Paysafe Results Presentation Deck
2021 full year financial highlights
Volume ($bn)
Revenue ($m)
$100.7
2020
$426
+22%
2020
margin 29.8%
Adj. EBITDA (¹) ($m)
$122.4
+4%
2021
$444
2021
29.9%
+5%
Ex. PL
take rate
$1,426
2020
1.4%
$356.3
2020
Paysafe: Note: Volume = total payment volume. Take rate= total revenue divided by volume.
+4%
FCF(¹) ($m)
$1,487
-20%
2021
1.2%
$286.3
2021
+6%
Ex. PL
●
●
●
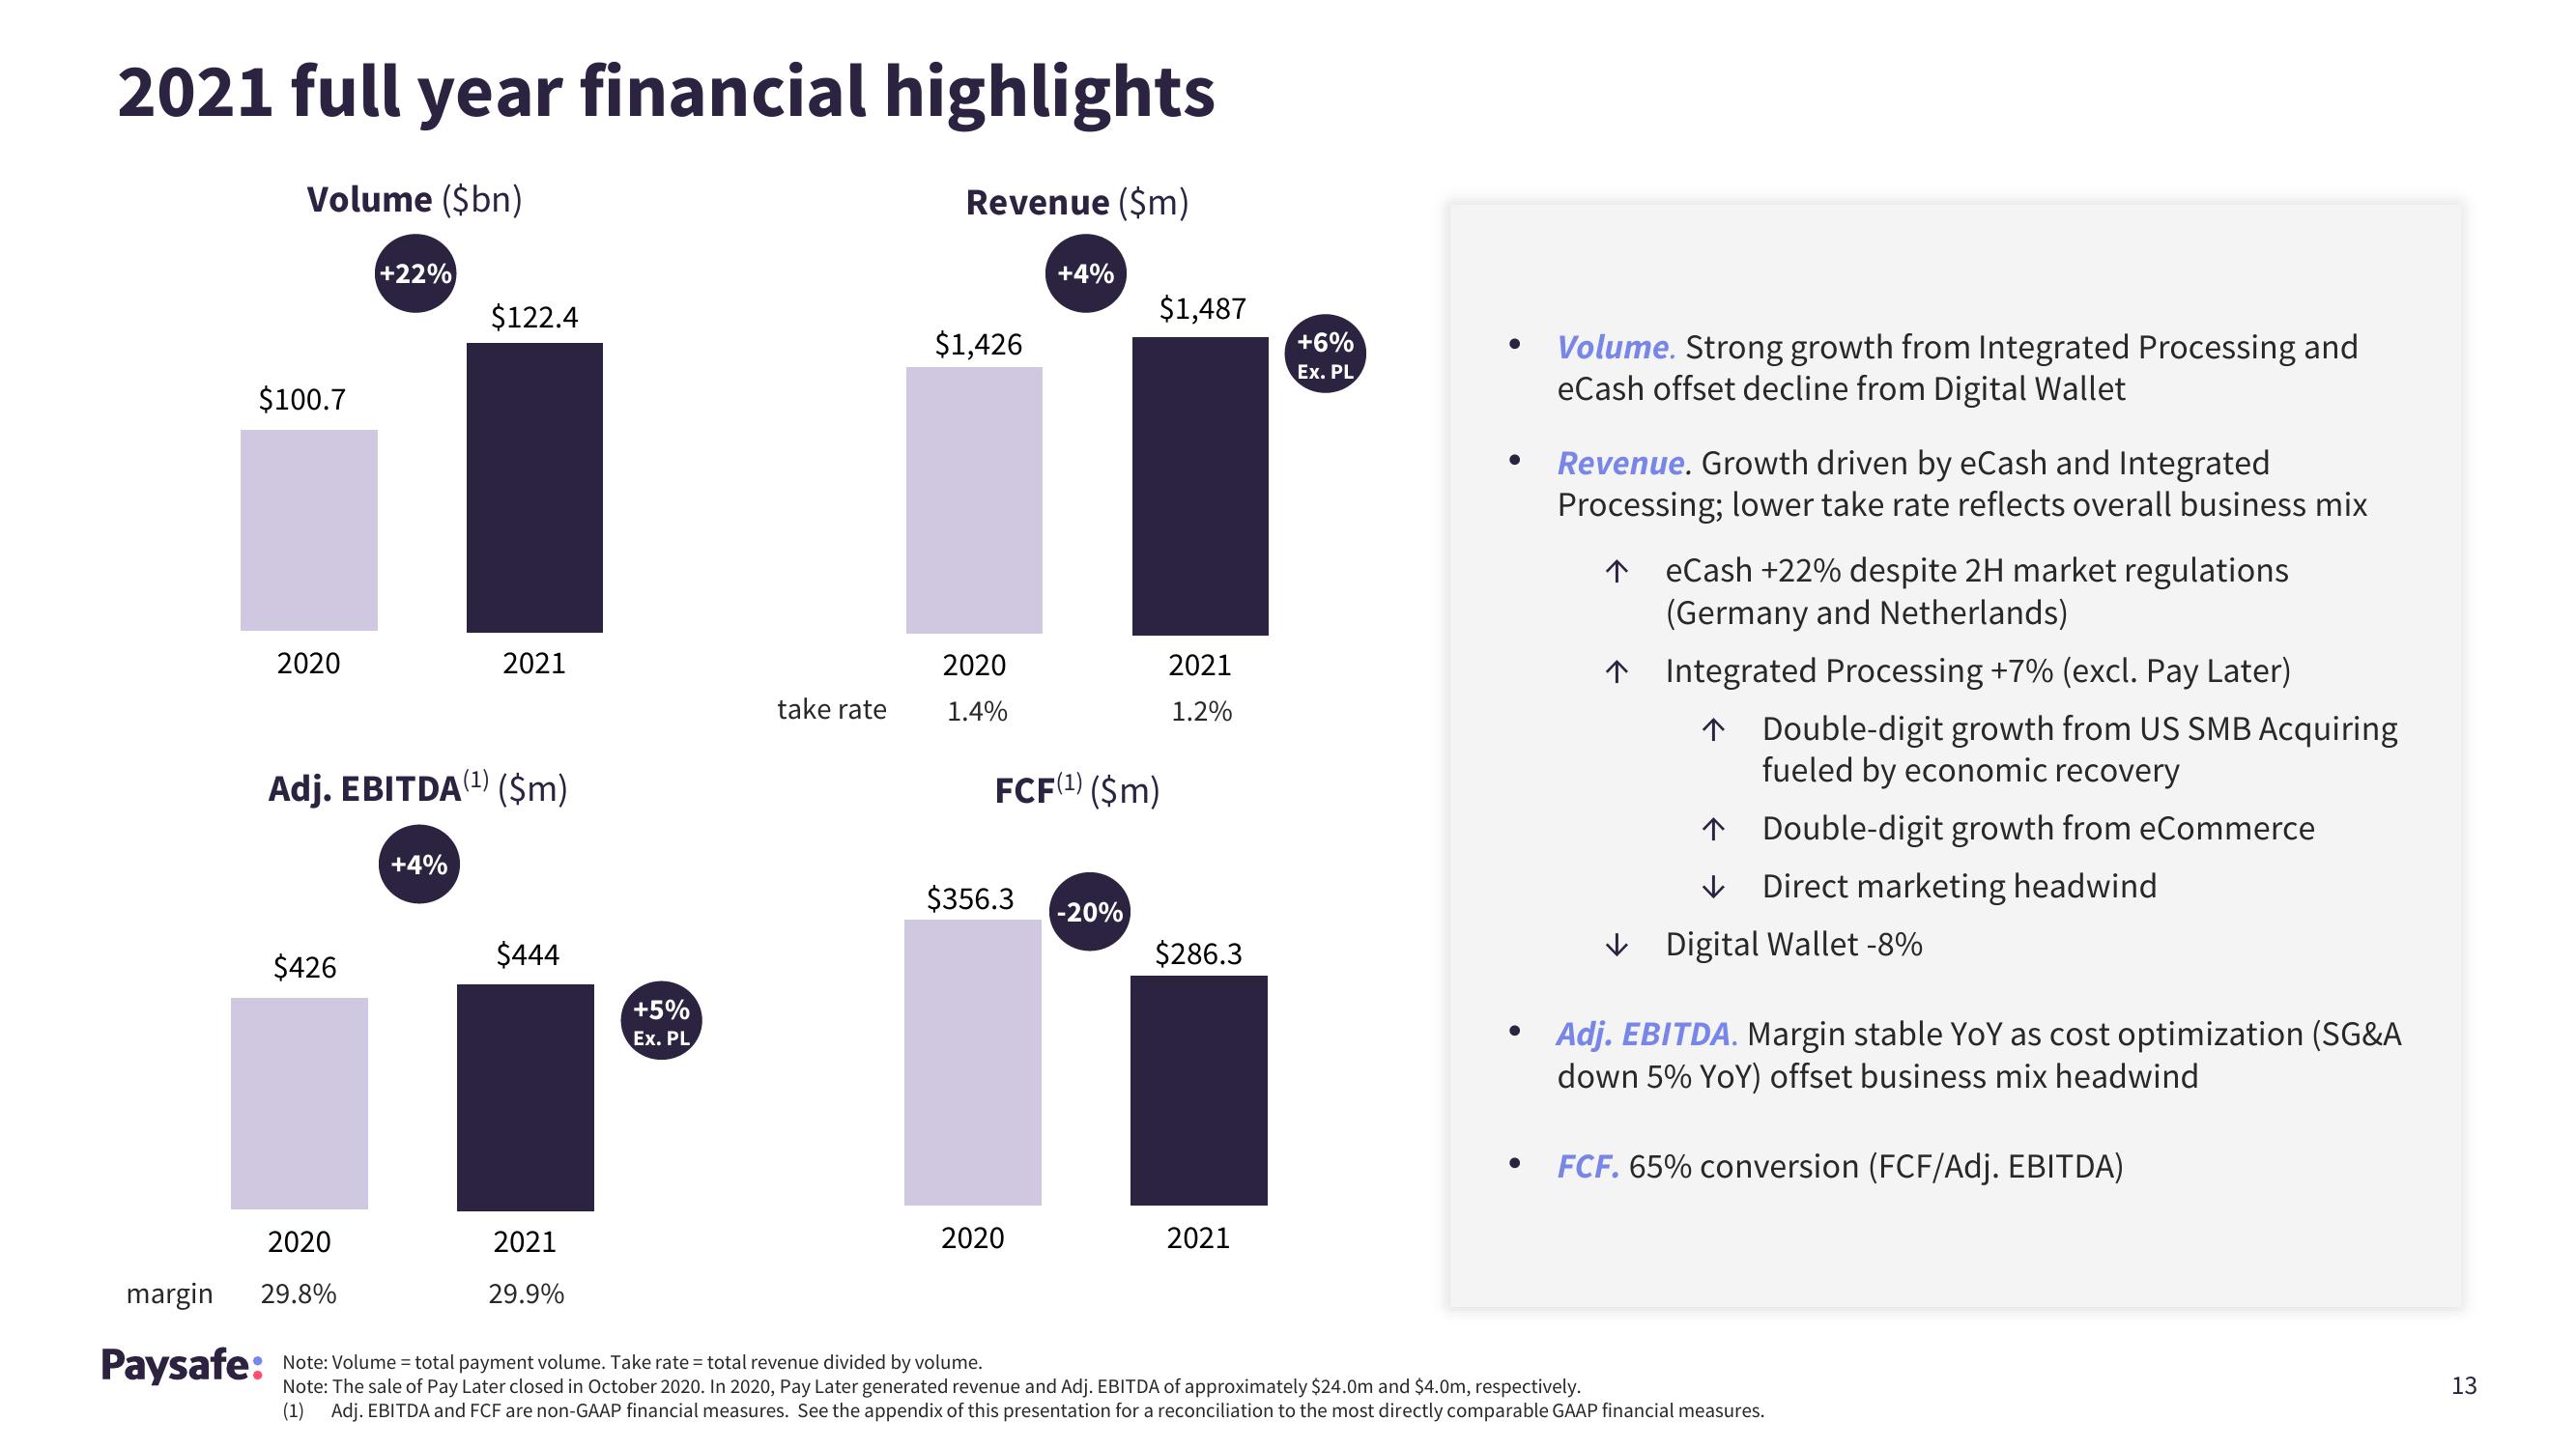
Volume. Strong growth from Integrated Processing and
eCash offset decline from Digital Wallet
Revenue. Growth driven by eCash and Integrated
Processing; lower take rate reflects overall business mix
个
eCash +22% despite 2H market regulations
(Germany and Netherlands)
↑ Integrated Processing +7% (excl. Pay Later)
↑ Double-digit growth from US SMB Acquiring
fueled by economic recovery
个 Double-digit growth from eCommerce
✓ Direct marketing headwind
Digital Wallet -8%
Adj. EBITDA. Margin stable YoY as cost optimization (SG&A
down 5% YoY) offset business mix headwind
FCF. 65% conversion (FCF/Adj. EBITDA)
Note: The sale of Pay Later closed in October 2020. In 2020, Pay Later generated revenue and Adj. EBITDA of approximately $24.0m and $4.0m, respectively.
(1) Adj. EBITDA and FCF are non-GAAP financial measures. See the appendix of this presentation for a reconciliation to the most directly comparable GAAP financial measures.
13View entire presentation