GMS Results Presentation Deck
Leverage Summary
($ mm)
Cash and cash equivalents
Revolving Credit Facilities
First Lien Term Loan
Senior Notes
Capital Lease Obligations
Installment Notes
Total Debt
Total Net Debt
PF Adj. EBITDA
Total Debt / PF Adj. EBITDA
Net Debt / PF Adj. EBITDA
GMS
GYPSUM MANAGEMENT & SUPPLY, INC.
(1)
(2)
(3)
(4)
(5)
10/31/22 1/31/23 4/30/23 7/31/23 10/31/23
LTM
LTM
LTM
LTM
LTM
$124
$240
499
345
126
3
$1,214
$1,090
$662
1.8x
1.6x
$187
$240
498
346
132
8
$1,223
$1,037
$668
1.8x
1.6x
$164
$110
497
346
137
8
$1,099
$935
$684
1.6x
1.4x
$81
$113
493
346
136
13
$77
$81
494
346
150
6
$1,102
$1,076
$1,021 $1,000
$678
$649
1.6x
1.5x
1.7x
1.5x
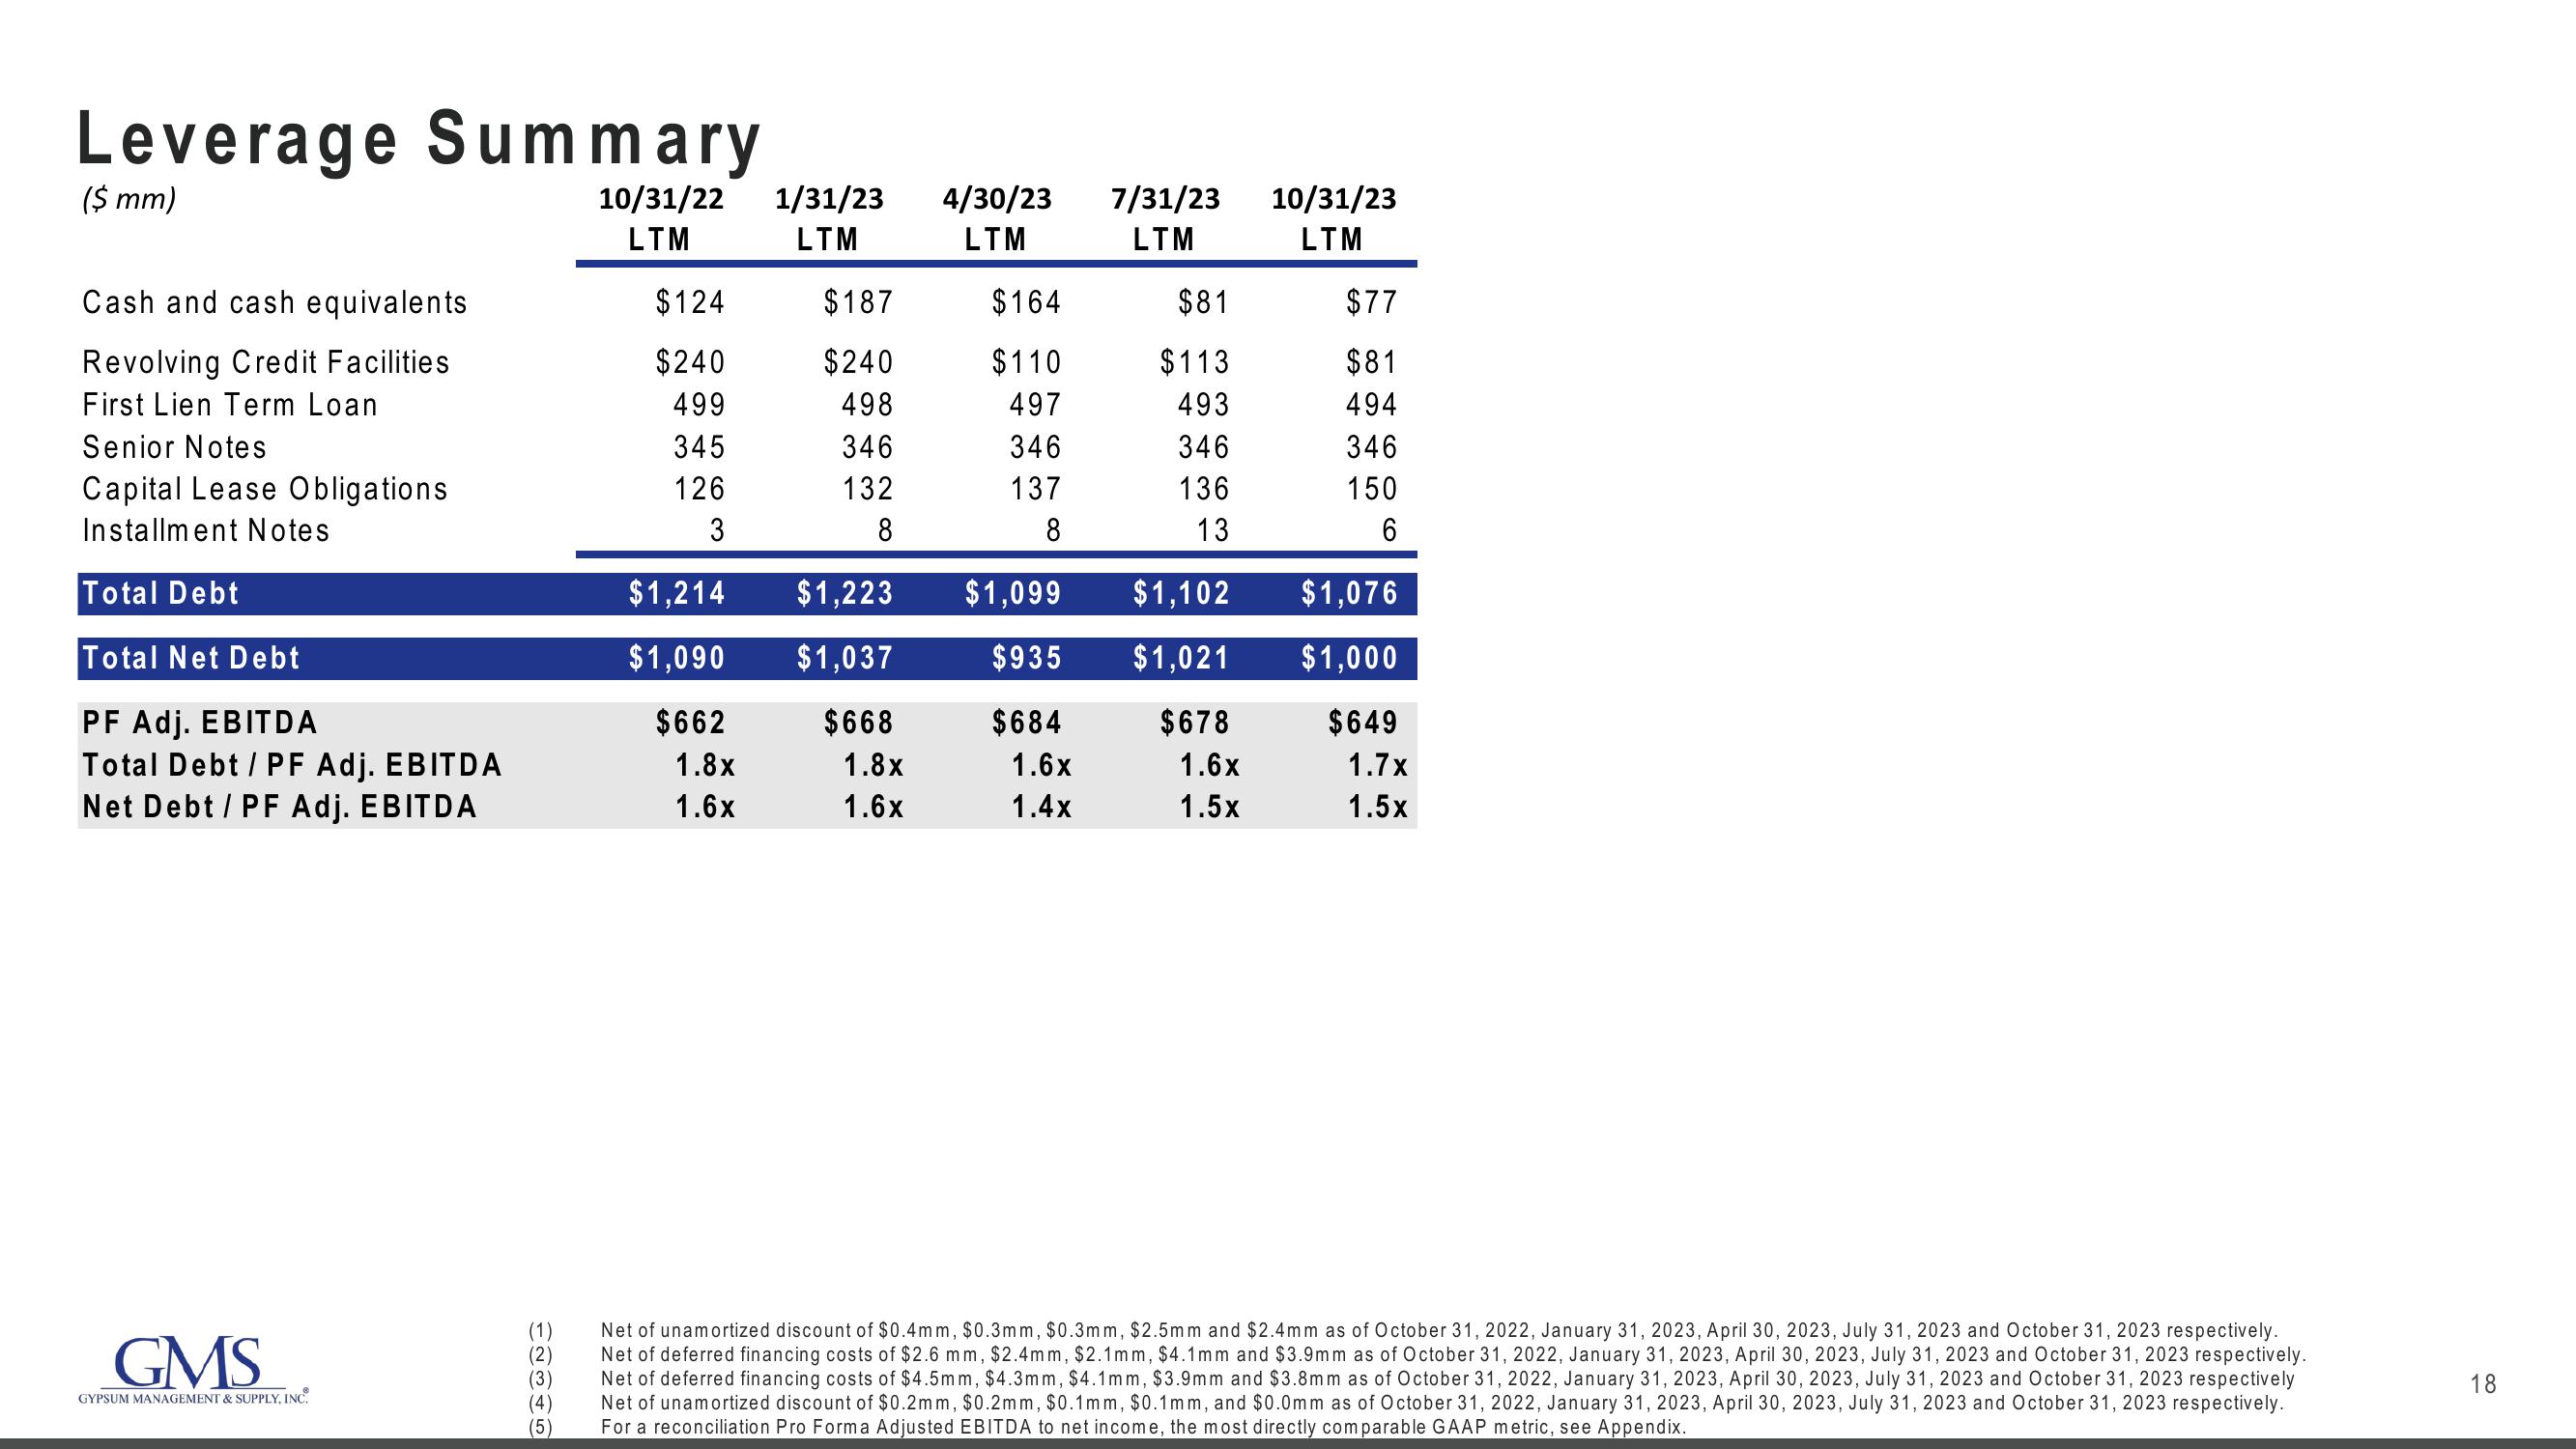
Net of unamortized discount of $0.4mm, $0.3mm, $0.3mm, $2.5mm and $2.4mm as of October 31, 2022, January 31, 2023, April 30, 2023, July 31, 2023 and October 31, 2023 respectively.
Net of deferred financing costs of $2.6 mm, $2.4mm, $2.1mm, $4.1mm and $3.9mm as of October 31, 2022, January 31, 2023, April 30, 2023, July 31, 2023 and October 31, 2023 respectively.
Net of deferred financing costs of $4.5mm, $4.3mm, $4.1mm, $3.9mm and $3.8mm as of October 31, 2022, January 31, 2023, April 30, 2023, July 31, 2023 and October 31, 2023 respectively
Net of unamortized discount of $0.2mm, $0.2mm, $0.1mm, $0.1mm, and $0.0mm as of October 31, 2022, January 31, 2023, April 30, 2023, July 31, 2023 and October 31, 2023 respectively.
For a reconciliation Pro Forma Adjusted EBITDA to net income, the most directly comparable GAAP metric, see Appendix.
18View entire presentation