EVE SPAC Presentation Deck
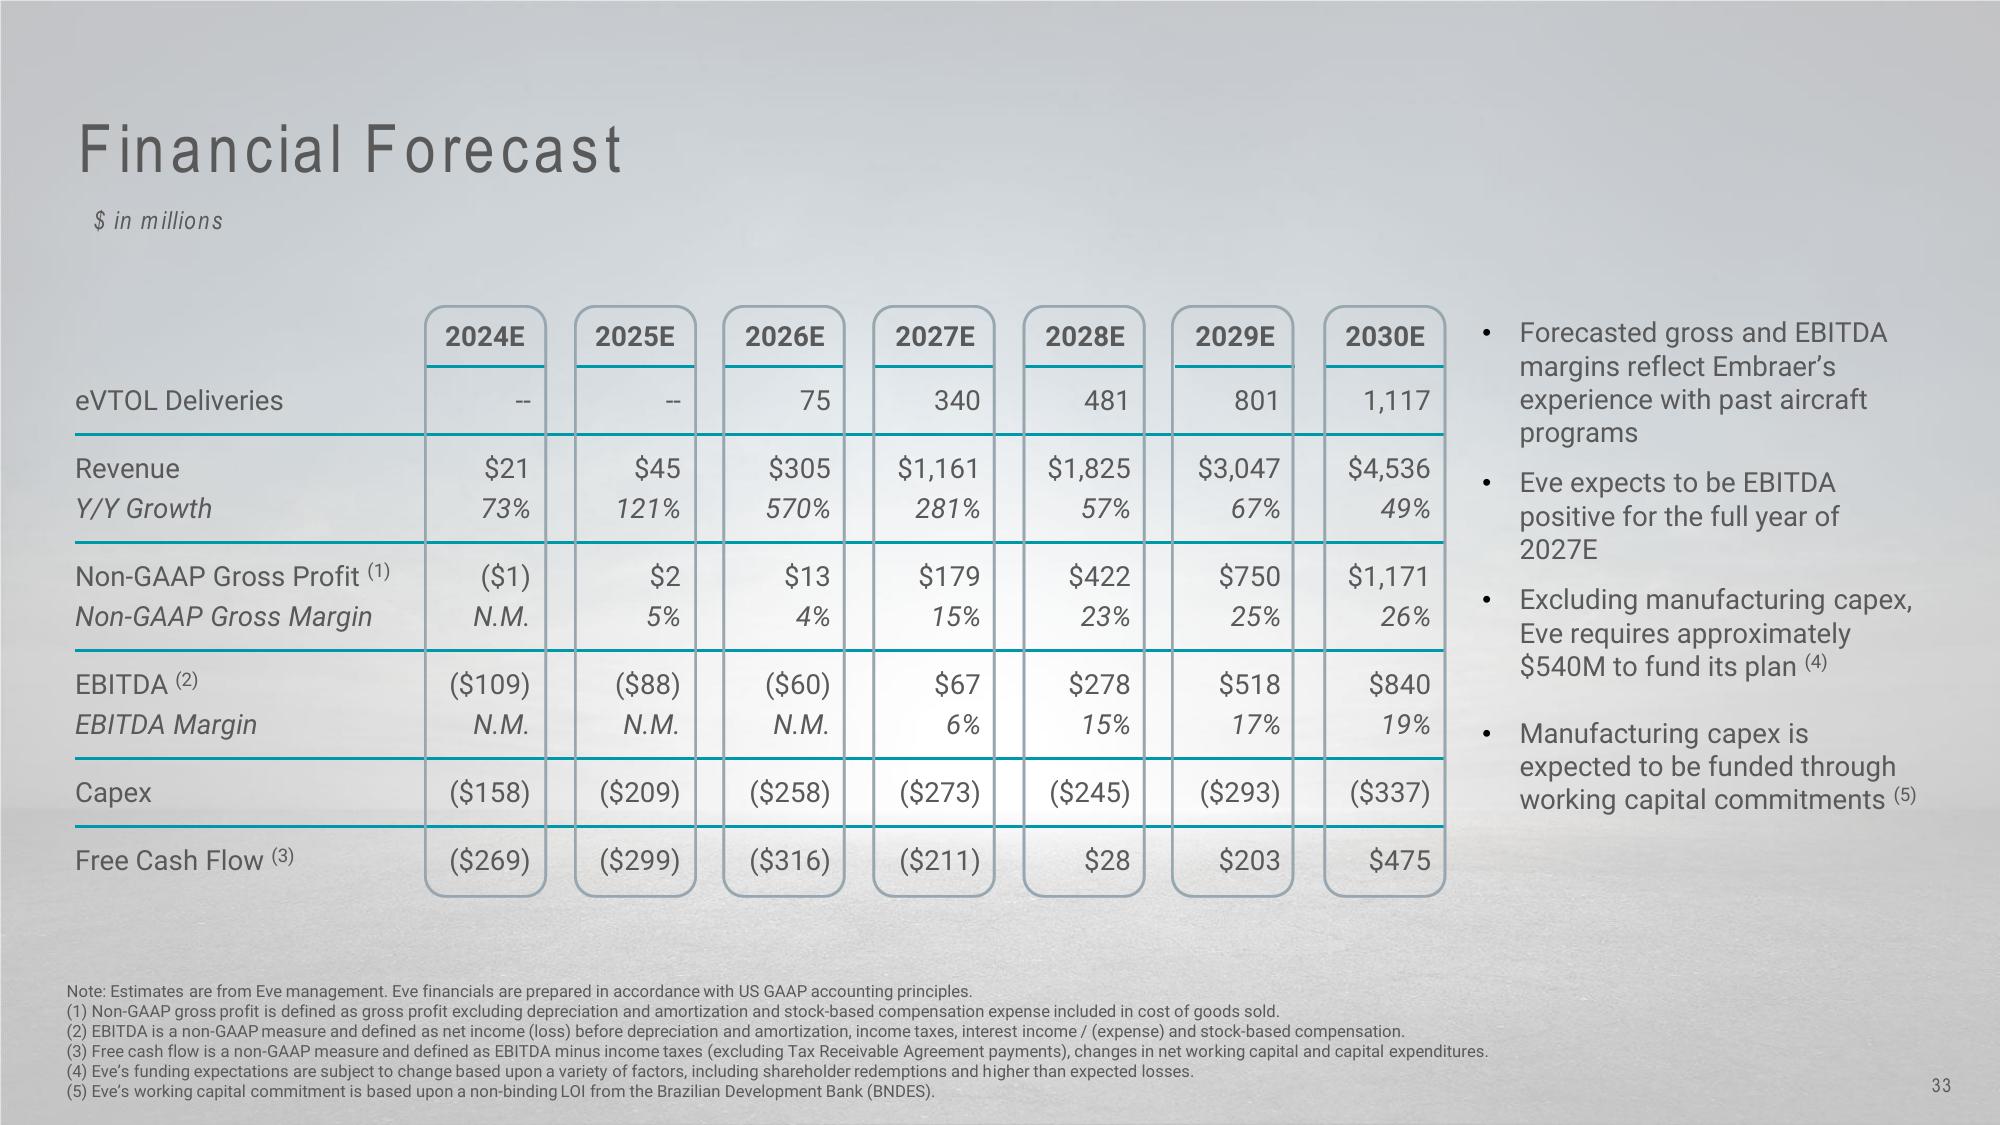
Financial Forecast
$ in millions
eVTOL Deliveries
Revenue
Y/Y Growth
Non-GAAP Gross Profit (1)
Non-GAAP Gross Margin
EBITDA (2)
EBITDA Margin
Capex
Free Cash Flow (3)
2024E
$21
73%
($1)
N.M.
($109)
N.M.
($158)
($269)
2025E
$45
121%
$2
5%
($88)
N.M.
($209)
($299)
2026E
75
$305
570%
$13
4%
($60)
N.M.
($258)
($316)
2027E
340
$1,161
281%
$179
15%
$67
6%
($273)
($211)
2028E
481
$422
23%
$1,825 $3,047
57%
67%
$278
15%
2029E
($245)
$28
801
$750
25%
$518
17%
($293)
$203
2030E
1,117
$4,536
49%
$1,171
26%
$840
19%
($337)
$475
●
●
●
●
Note: Estimates are from Eve management. Eve financials are prepared in accordance with US GAAP accounting principles.
(1) Non-GAAP gross profit is defined as gross profit excluding depreciation and amortization and stock-based compensation expense included in cost of goods sold.
(2) EBITDA is a non-GAAP measure and defined as net income (loss) before depreciation and amortization, income taxes, interest income / (expense) and stock-based compensation.
(3) Free cash flow is a non-GAAP measure and defined as EBITDA minus income taxes (excluding Tax Receivable Agreement payments), changes in net working capital and capital expenditures.
(4) Eve's funding expectations are subject to change based upon a variety of factors, including shareholder redemptions and higher than expected losses.
(5) Eve's working capital commitment is based upon a non-binding LOI from the Brazilian Development Bank (BNDES).
Forecasted gross and EBITDA
margins reflect Embraer's
experience with past aircraft
programs
Eve expects to be EBITDA
positive for the full year of
2027E
Excluding manufacturing capex,
Eve requires approximately
$540M to fund its plan (4)
Manufacturing capex is
expected to be funded through
working capital commitments (5)
33View entire presentation