AMC Mergers and Acquisitions Presentation Deck
Combined Prospect Better for Carmike Shareholders than Standalone
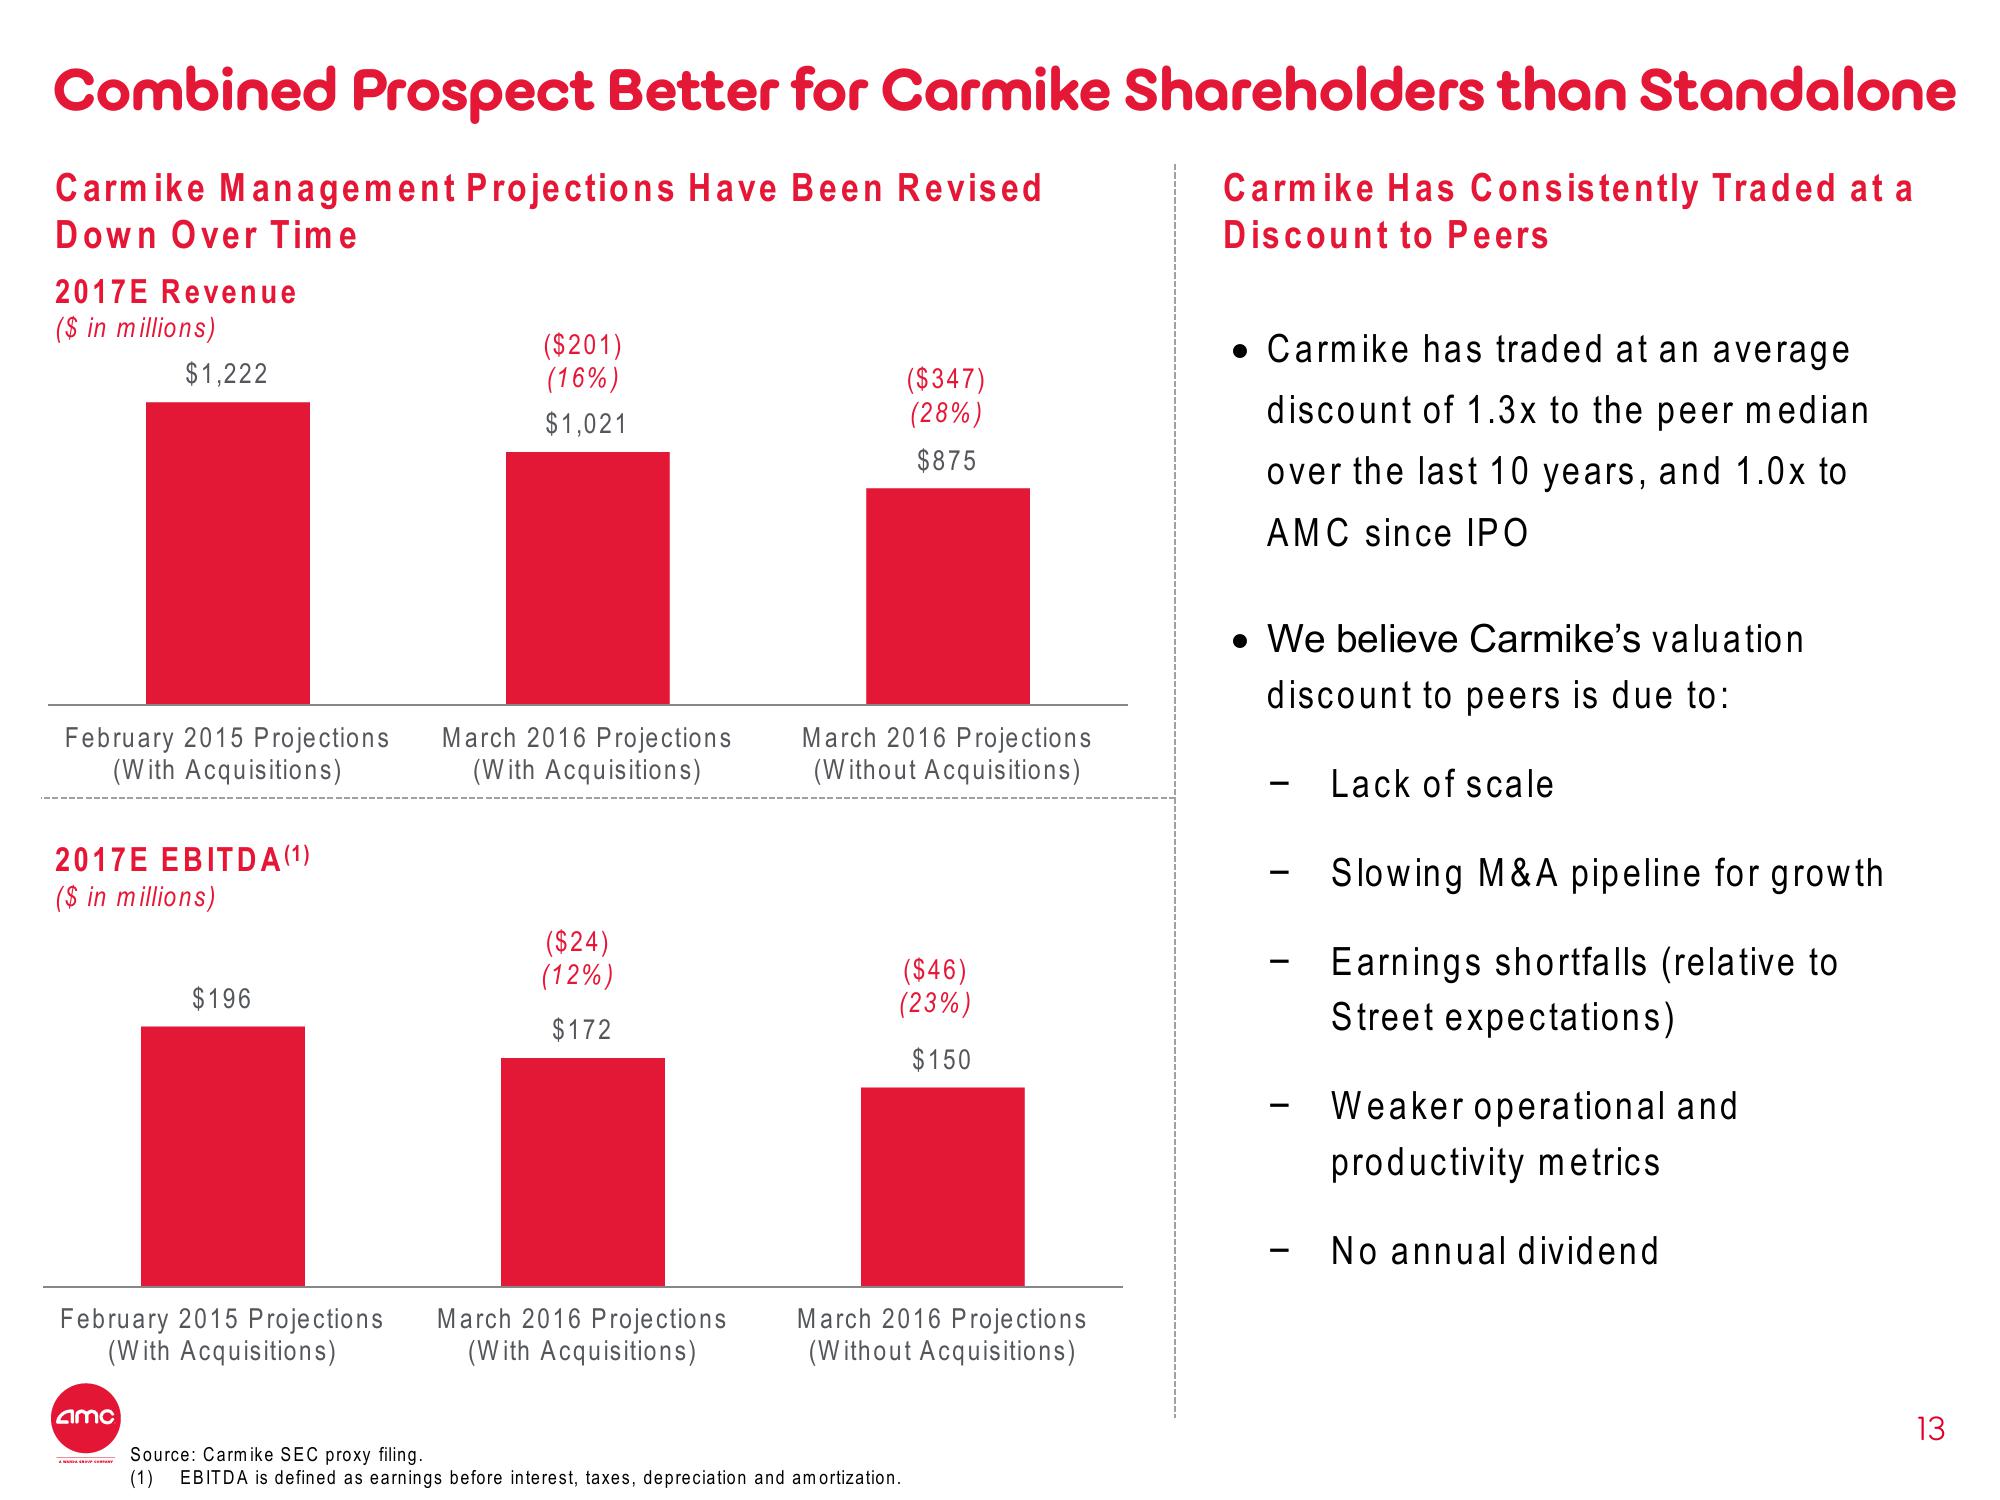
Carmike Management Projections Have Been Revised
Carmike Has Consistently Traded at a
Discount to Peers
Down Over Time
2017E Revenue
($ in millions)
$1,222
February 2015 Projections
(With Acquisitions)
2017E EBITDA (1)
($ in millions)
amc
$196
February 2015 Projections
(With Acquisitions)
($201)
(16%)
$1,021
March 2016 Projections
(With Acquisitions)
($24)
(12%)
$172
March 2016 Projections
(With Acquisitions)
($347)
(28%)
$875
March 2016 Projections
(Without Acquisitions)
($46)
(23%)
$150
March 2016 Projections
(Without Acquisitions)
Source: Carmike SEC proxy filing.
(1) EBITDA is defined as earnings before interest, taxes, depreciation and amortization.
. Carmike has traded at an average
discount of 1.3x to the peer median
over the last 10 years, and 1.0x to
AMC since IPO
• We believe Carmike's valuation
discount to peers is due to:
Lack of scale
Slowing M&A pipeline for growth
Earnings shortfalls (relative to
Street expectations)
Weaker operational and
productivity metrics
No annual dividend
13View entire presentation