FAT Brands Investor Presentation Deck
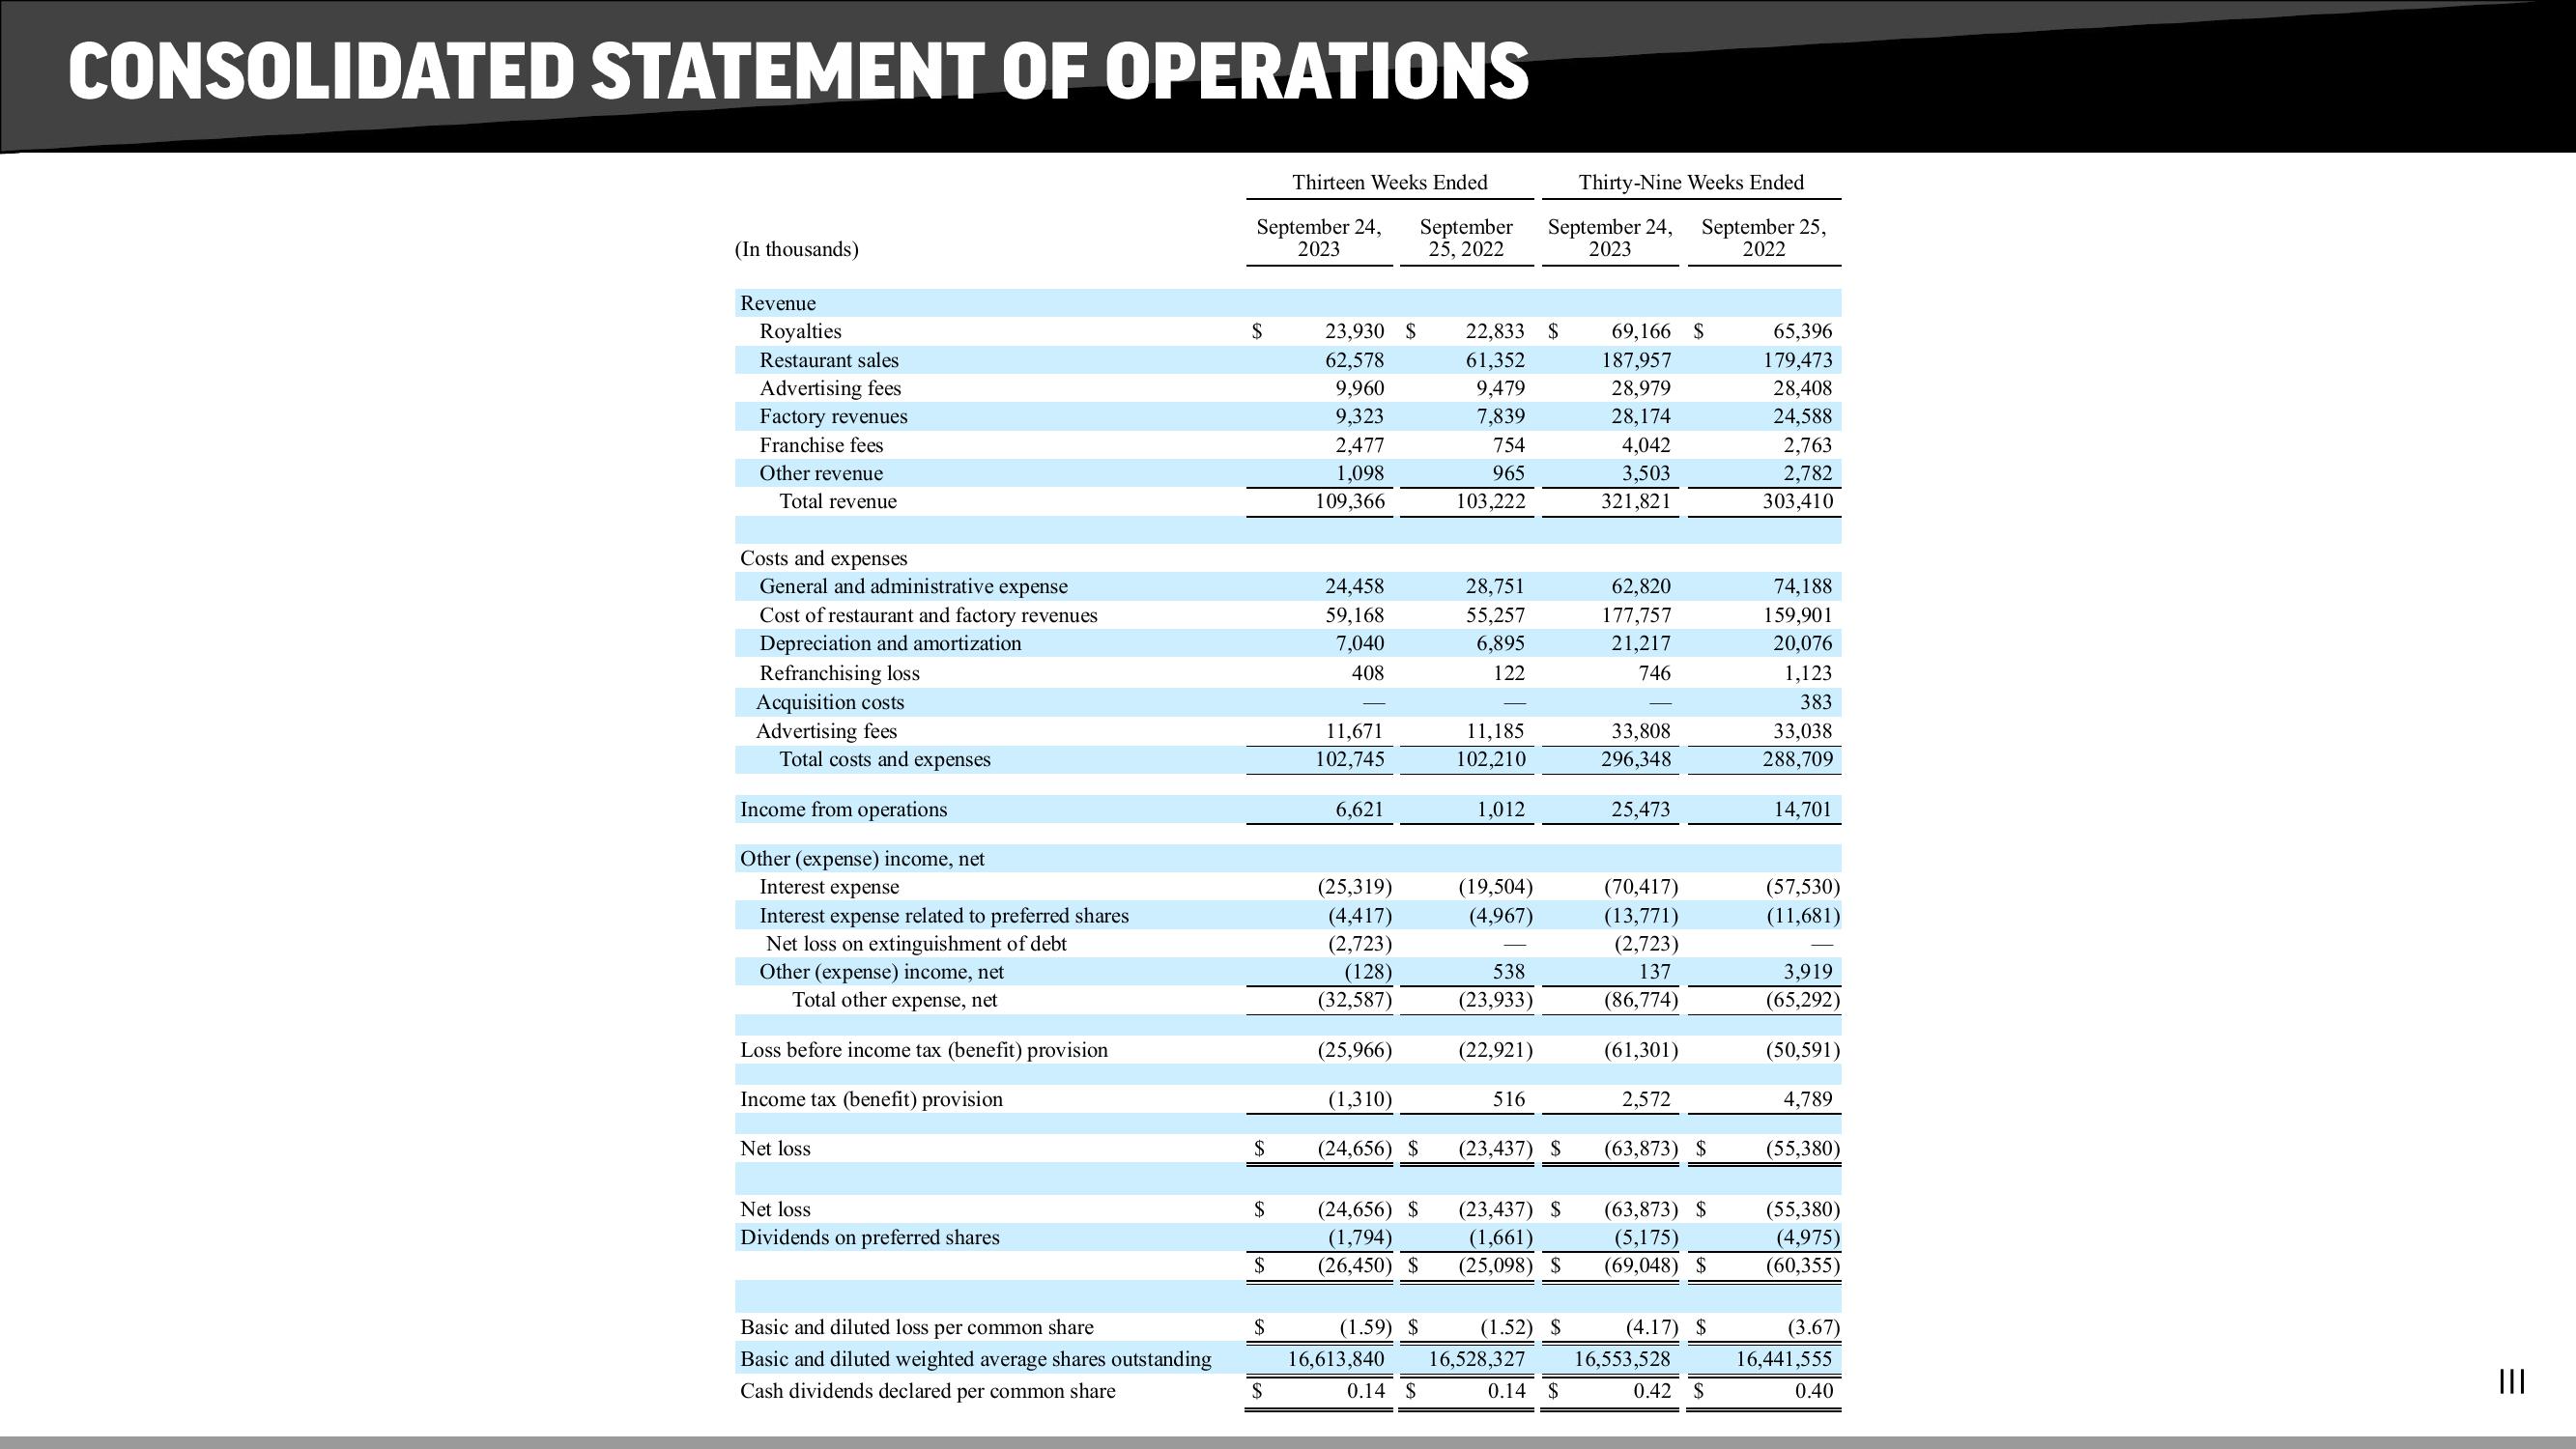
CONSOLIDATED STATEMENT OF OPERATIONS
(In thousands)
Revenue
Royalties
Restaurant sales
Advertising fees
Factory revenues
Franchise fees
Other revenue
Total revenue
Costs and expenses
General and administrative expense
Cost of restaurant and factory revenues
Depreciation and amortization
Refranchising loss
Acquisition costs
Advertising fees
Total costs and expenses
Income from operations
Other (expense) income, net
Interest expense
Interest expense related to preferred shares
Net loss on extinguishment of debt
Other (expense) income, net
Total other expense, net
Loss before income tax (benefit) provision
Income tax (benefit) provision
Net loss
Net loss
Dividends on preferred shares
Basic and diluted loss per common share
Basic and diluted weighted average shares outstanding
Cash dividends declared per common share
September 24, September
2023
25, 2022
$
$
$
$
$
Thirteen Weeks Ended
$
23,930 $
62,578
9,960
9,323
2,477
1,098
109,366
24,458
59,168
7,040
408
11,671
102,745
6,621
(25,319)
(4,417)
(2,723)
(128)
(32,587)
(25,966)
(1,310)
(24,656) $
(24,656) $
(1,794)
(26,450) $
(1.59) $
16,613,840
0.14
$
22,833 $
61,352
9,479
7,839
754
965
103,222
28,751
55,257
6,895
122
11,185
102,210
1,012
(19,504)
(4,967)
538
(23,933)
(22,921)
Thirty-Nine Weeks Ended
September 24, September 25,
2023
2022
516
(23,437) $
(23,437) $
(1,661)
(25,098) $
(1.52) $
16,528,327
0.14 $
69,166 $
187,957
28,979
28,174
4,042
3,503
321,821
62,820
177,757
21,217
746
33,808
296,348
25,473
(70,417)
(13,771)
(2,723)
137
(86,774)
(61,301)
2,572
(63,873) $
(63,873) $
(5,175)
(69,048) $
(4.17) $
16,553,528
0.42 $
65,396
179,473
28,408
24,588
2,763
2,782
303,410
74,188
159,901
20,076
1,123
383
33,038
288,709
14,701
(57,530)
(11,681)
3,919
(65,292)
(50,591)
4,789
(55,380)
(55,380)
(4,975)
(60,355)
(3.67)
16,441,555
0.40
|||View entire presentation