GMS Investor Conference Presentation Deck
Fiscal YTD Q3 FY2023 Highlights
Record Levels of Net Sales, Net Income and Adjusted EBITDA¹
for Fiscal YTD Q3 FY23
Comparisons below are to YTD Q3 FY22
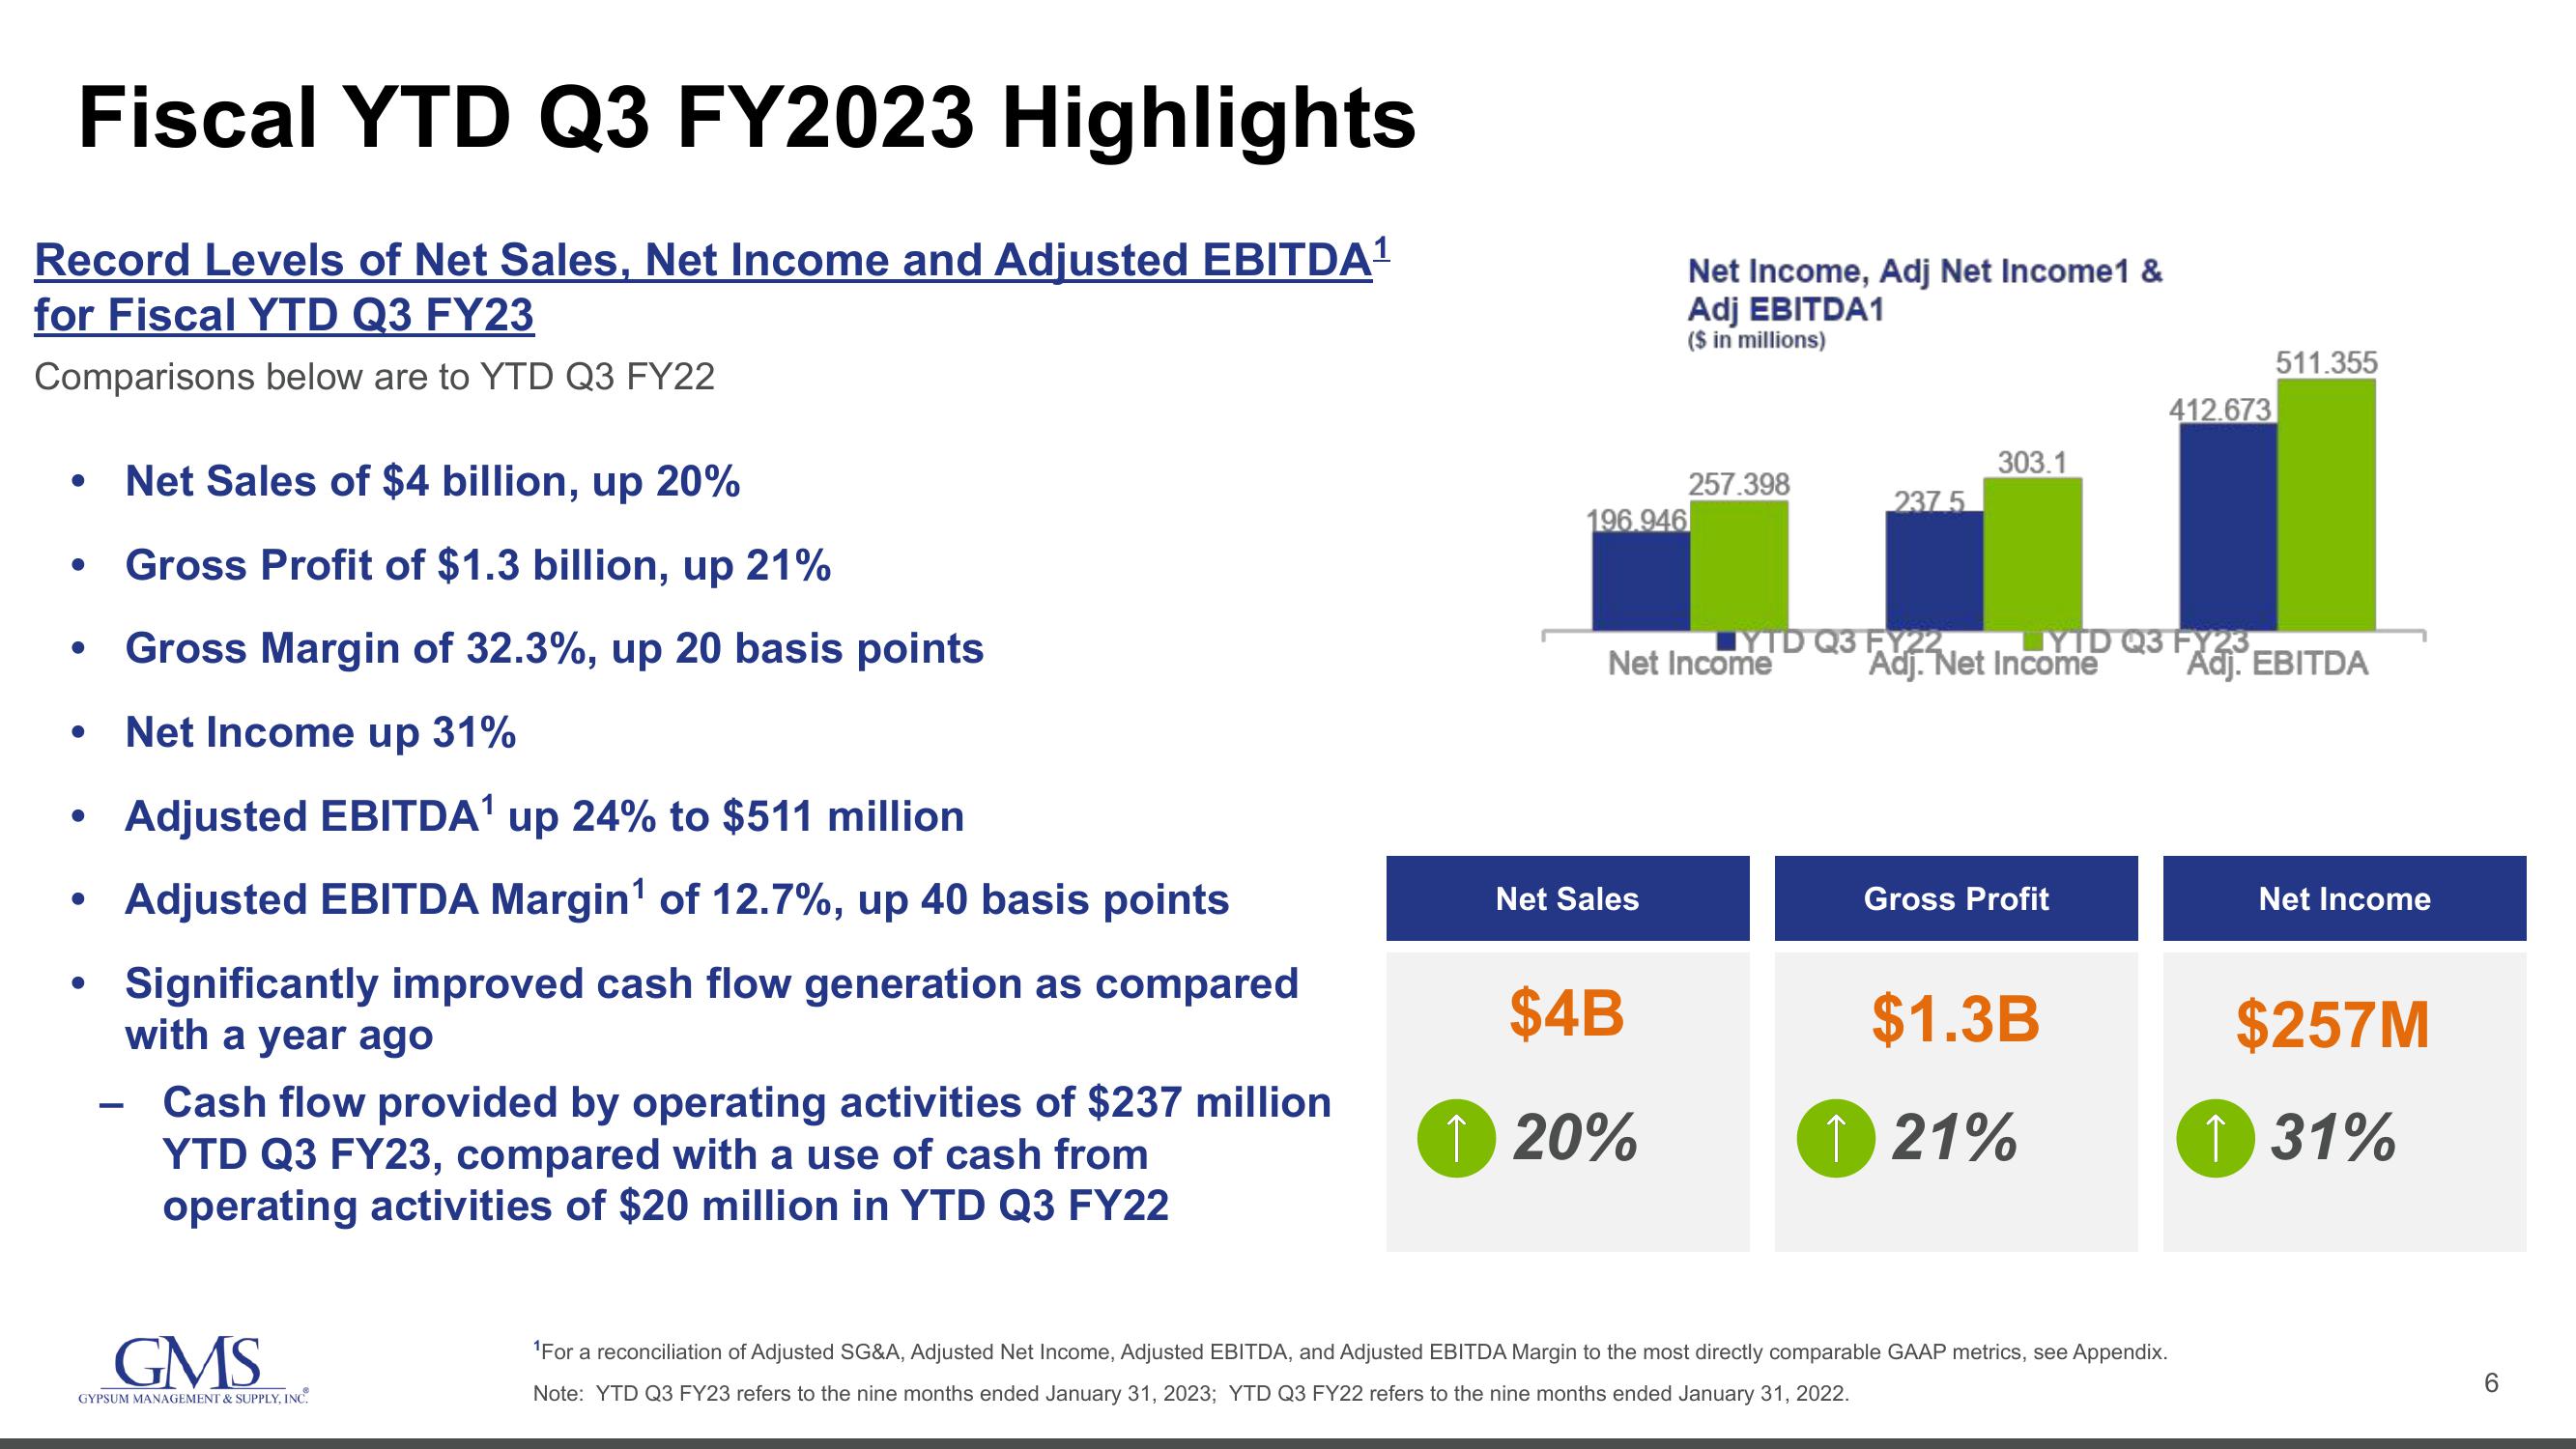
Net Sales of $4 billion, up 20%
Gross Profit of $1.3 billion, up 21%
Gross Margin of 32.3%, up 20 basis points
Net Income up 31%
• Adjusted EBITDA¹ up 24% to $511 million
Adjusted EBITDA Margin¹ of 12.7%, up 40 basis points
Significantly improved cash flow generation as compared
with a year ago
Cash flow provided by operating activities of $237 million
YTD Q3 FY23, compared with a use of cash from
operating activities of $20 million in YTD Q3 FY22
●
●
●
●
-
GMS
GYPSUM MANAGEMENT & SUPPLY, INC.
196.946
Net Income, Adj Net Income1 &
Adj EBITDA1
($ in millions)
Net Sales
$4B
↑ 20%
257.398
Net Income
237 5
YTD Q3 FY22.
303.1
Adj. Net Income
Gross Profit
LYTD Q3 FY23,
Adj. EBITDA
$1.3B
↑ 21%
412.673
¹For a reconciliation of Adjusted SG&A, Adjusted Net Income, Adjusted EBITDA, and Adjusted EBITDA Margin to the most directly comparable GAAP metrics, see Appendix.
Note: YTD Q3 FY23 refers to the nine months ended January 31, 2023; YTD Q3 FY22 refers to the nine months ended January 31, 2022.
511.355
Net Income
$257M
↑ 31%
6View entire presentation