Dave Investor Presentation Deck
Consistent revenue
growth
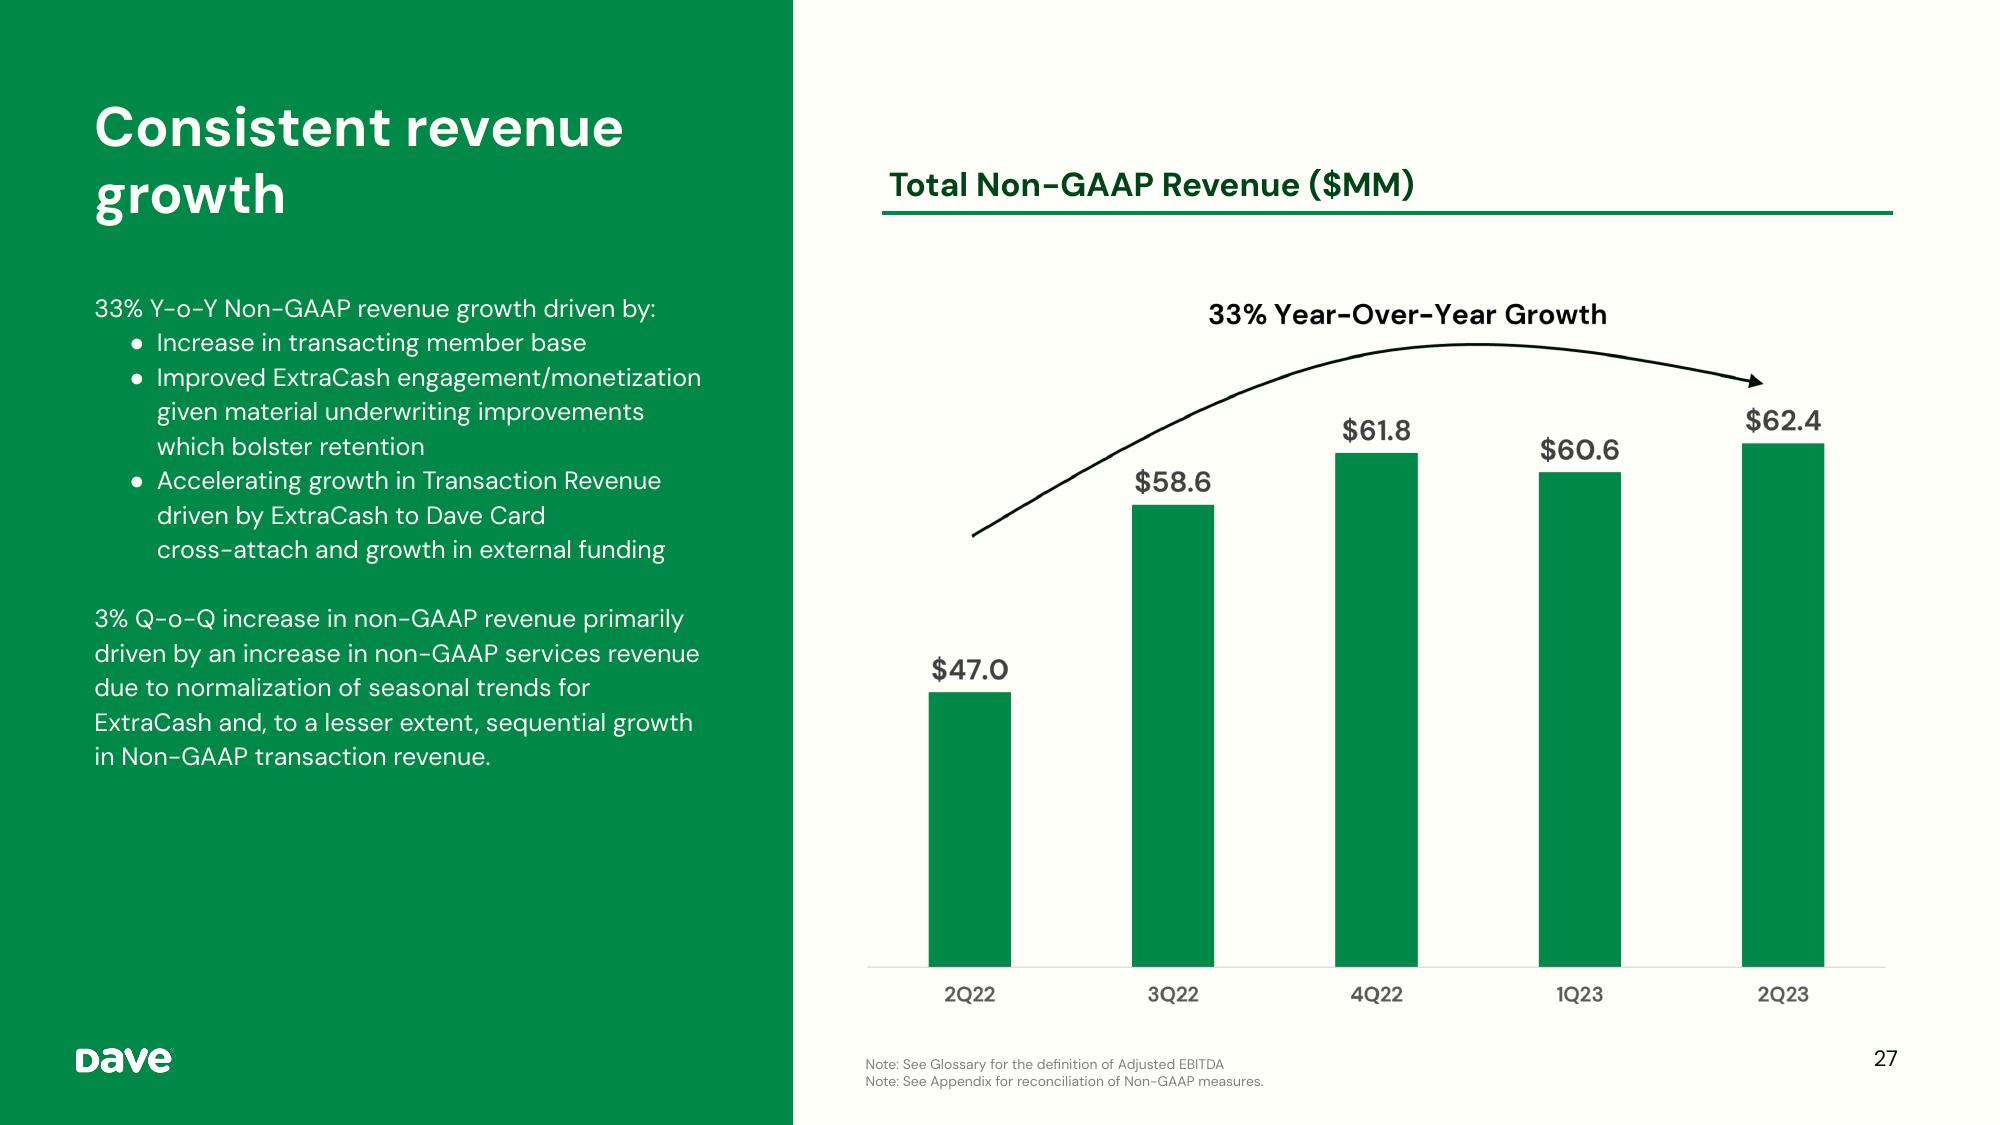
33% Y-o-Y Non-GAAP revenue growth driven by:
Increase in transacting member base
• Improved ExtraCash engagement/monetization
given material underwriting improvements
which bolster retention
Accelerating growth in Transaction Revenue
driven by ExtraCash to Dave Card
cross-attach and growth in external funding
3% Q-o-Q increase in non-GAAP revenue primarily
driven by an increase in non-GAAP services revenue
due to normalization of seasonal trends for
ExtraCash and, to a lesser extent, sequential growth
in Non-GAAP transaction revenue.
Dave
Total Non-GAAP Revenue ($MM)
$47.0
2Q22
33% Year-Over-Year Growth
$58.6
3Q22
Note: See Glossary for the definition of Adjusted EBITDA
Note: See Appendix for reconciliation of Non-GAAP measures.
$61.8
4Q22
$60.6
1Q23
$62.4
2Q23
27View entire presentation