WeWork Results Presentation Deck
Building Margin by market
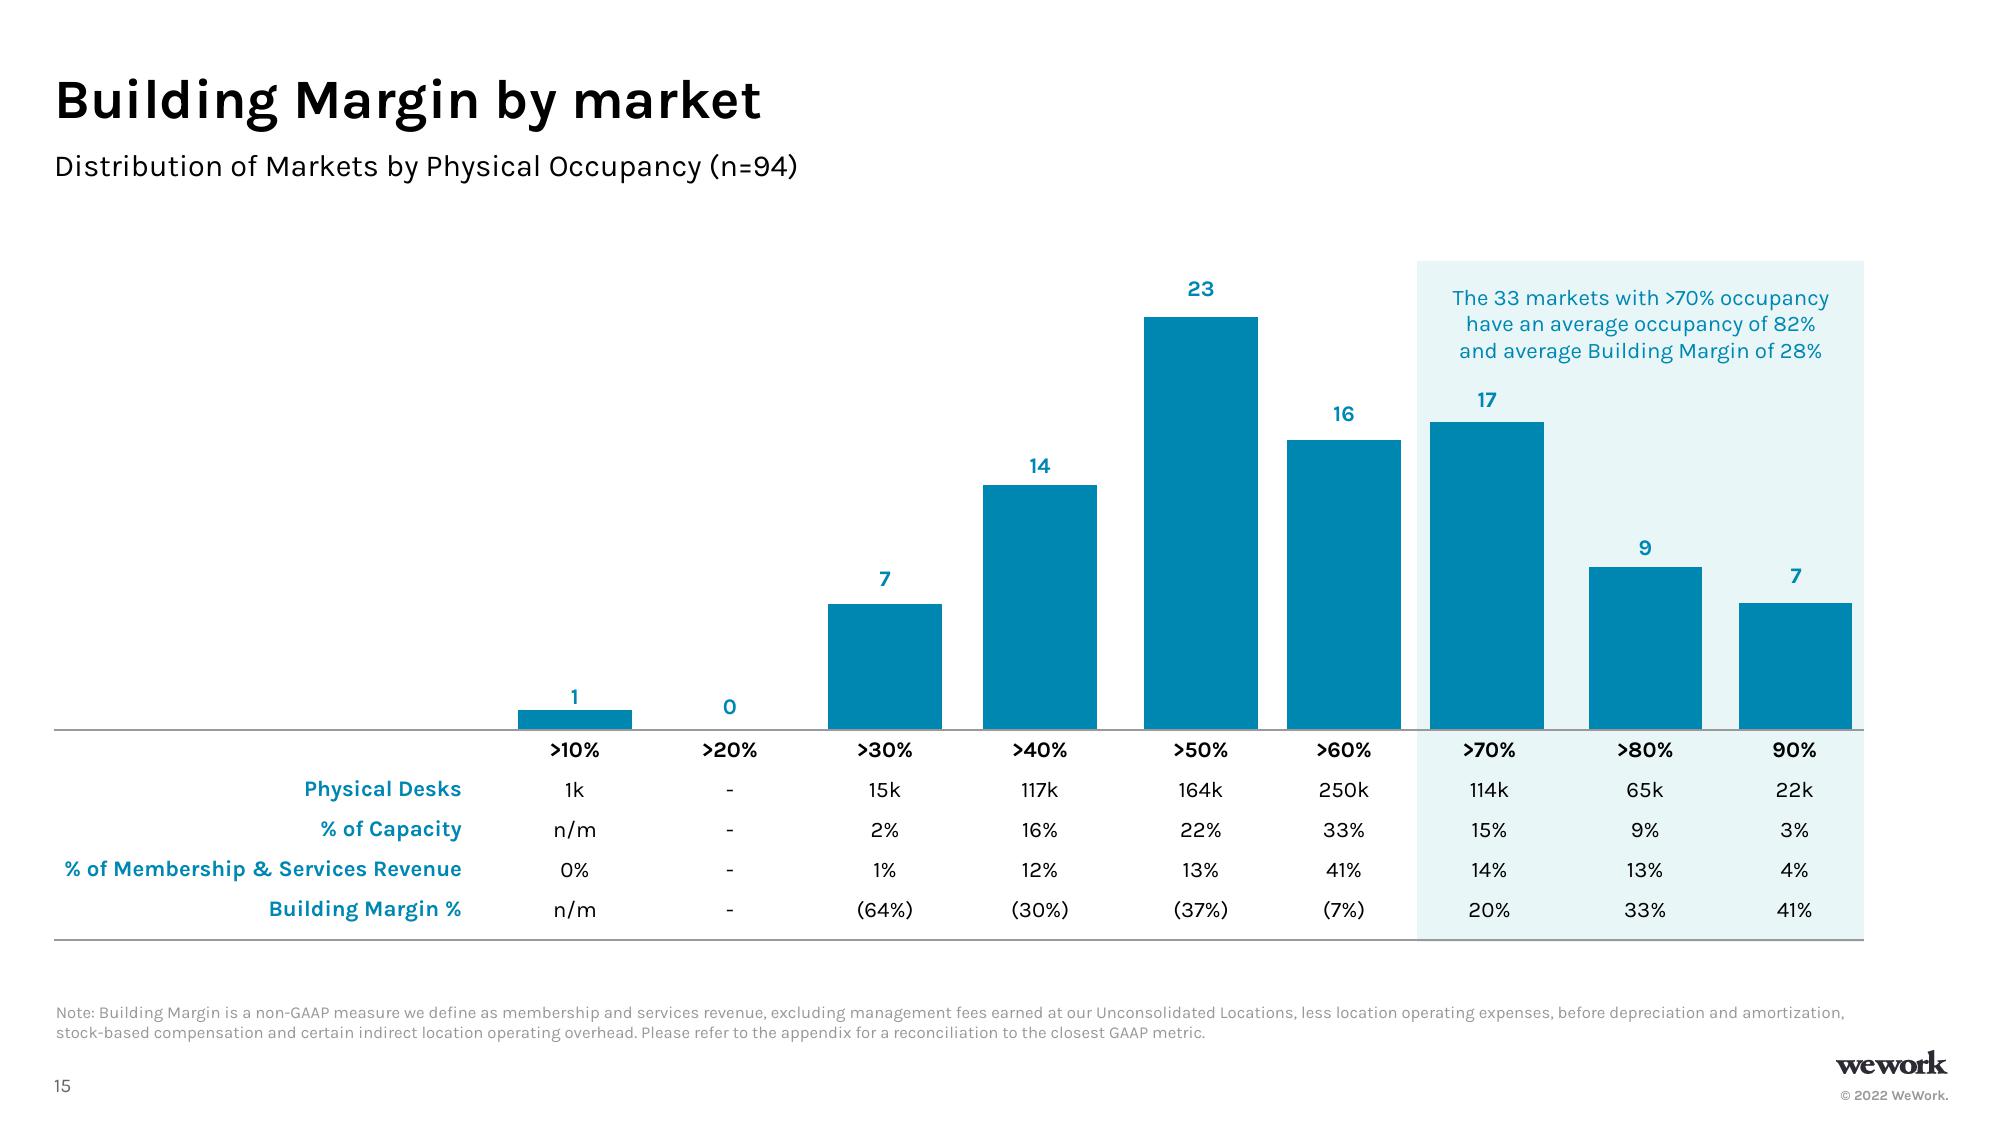
Distribution of Markets by Physical Occupancy (n=94)
Physical Desks
% of Capacity
% of Membership & Services Revenue
Building Margin %
>10%
1k
n/m
0%
n/m
15
O
>20%
7
>30%
15k
2%
1%
(64%)
14
>40%
117k
16%
12%
(30%)
23
>50%
164k
22%
13%
(37%)
16
>60%
250k
33%
41%
(7%)
The 33 markets with >70% occupancy
have an average occupancy of 82%
and average Building Margin of 28%
17
>70%
114k
15%
14%
20%
6
>80%
65k
9%
13%
33%
7
90%
22k
3%
4%
41%
Note: Building Margin is a non-GAAP measure we define as membership and services revenue, excluding management fees earned at our Unconsolidated Locations, less location operating expenses, before depreciation and amortization,
stock-based compensation and certain indirect location operating overhead. Please refer to the appendix for a reconciliation to the closest GAAP metric.
wework
Ⓒ2022 WeWork.View entire presentation