P3 Health Partners SPAC Presentation Deck
Right Space
Right Team
Right Model
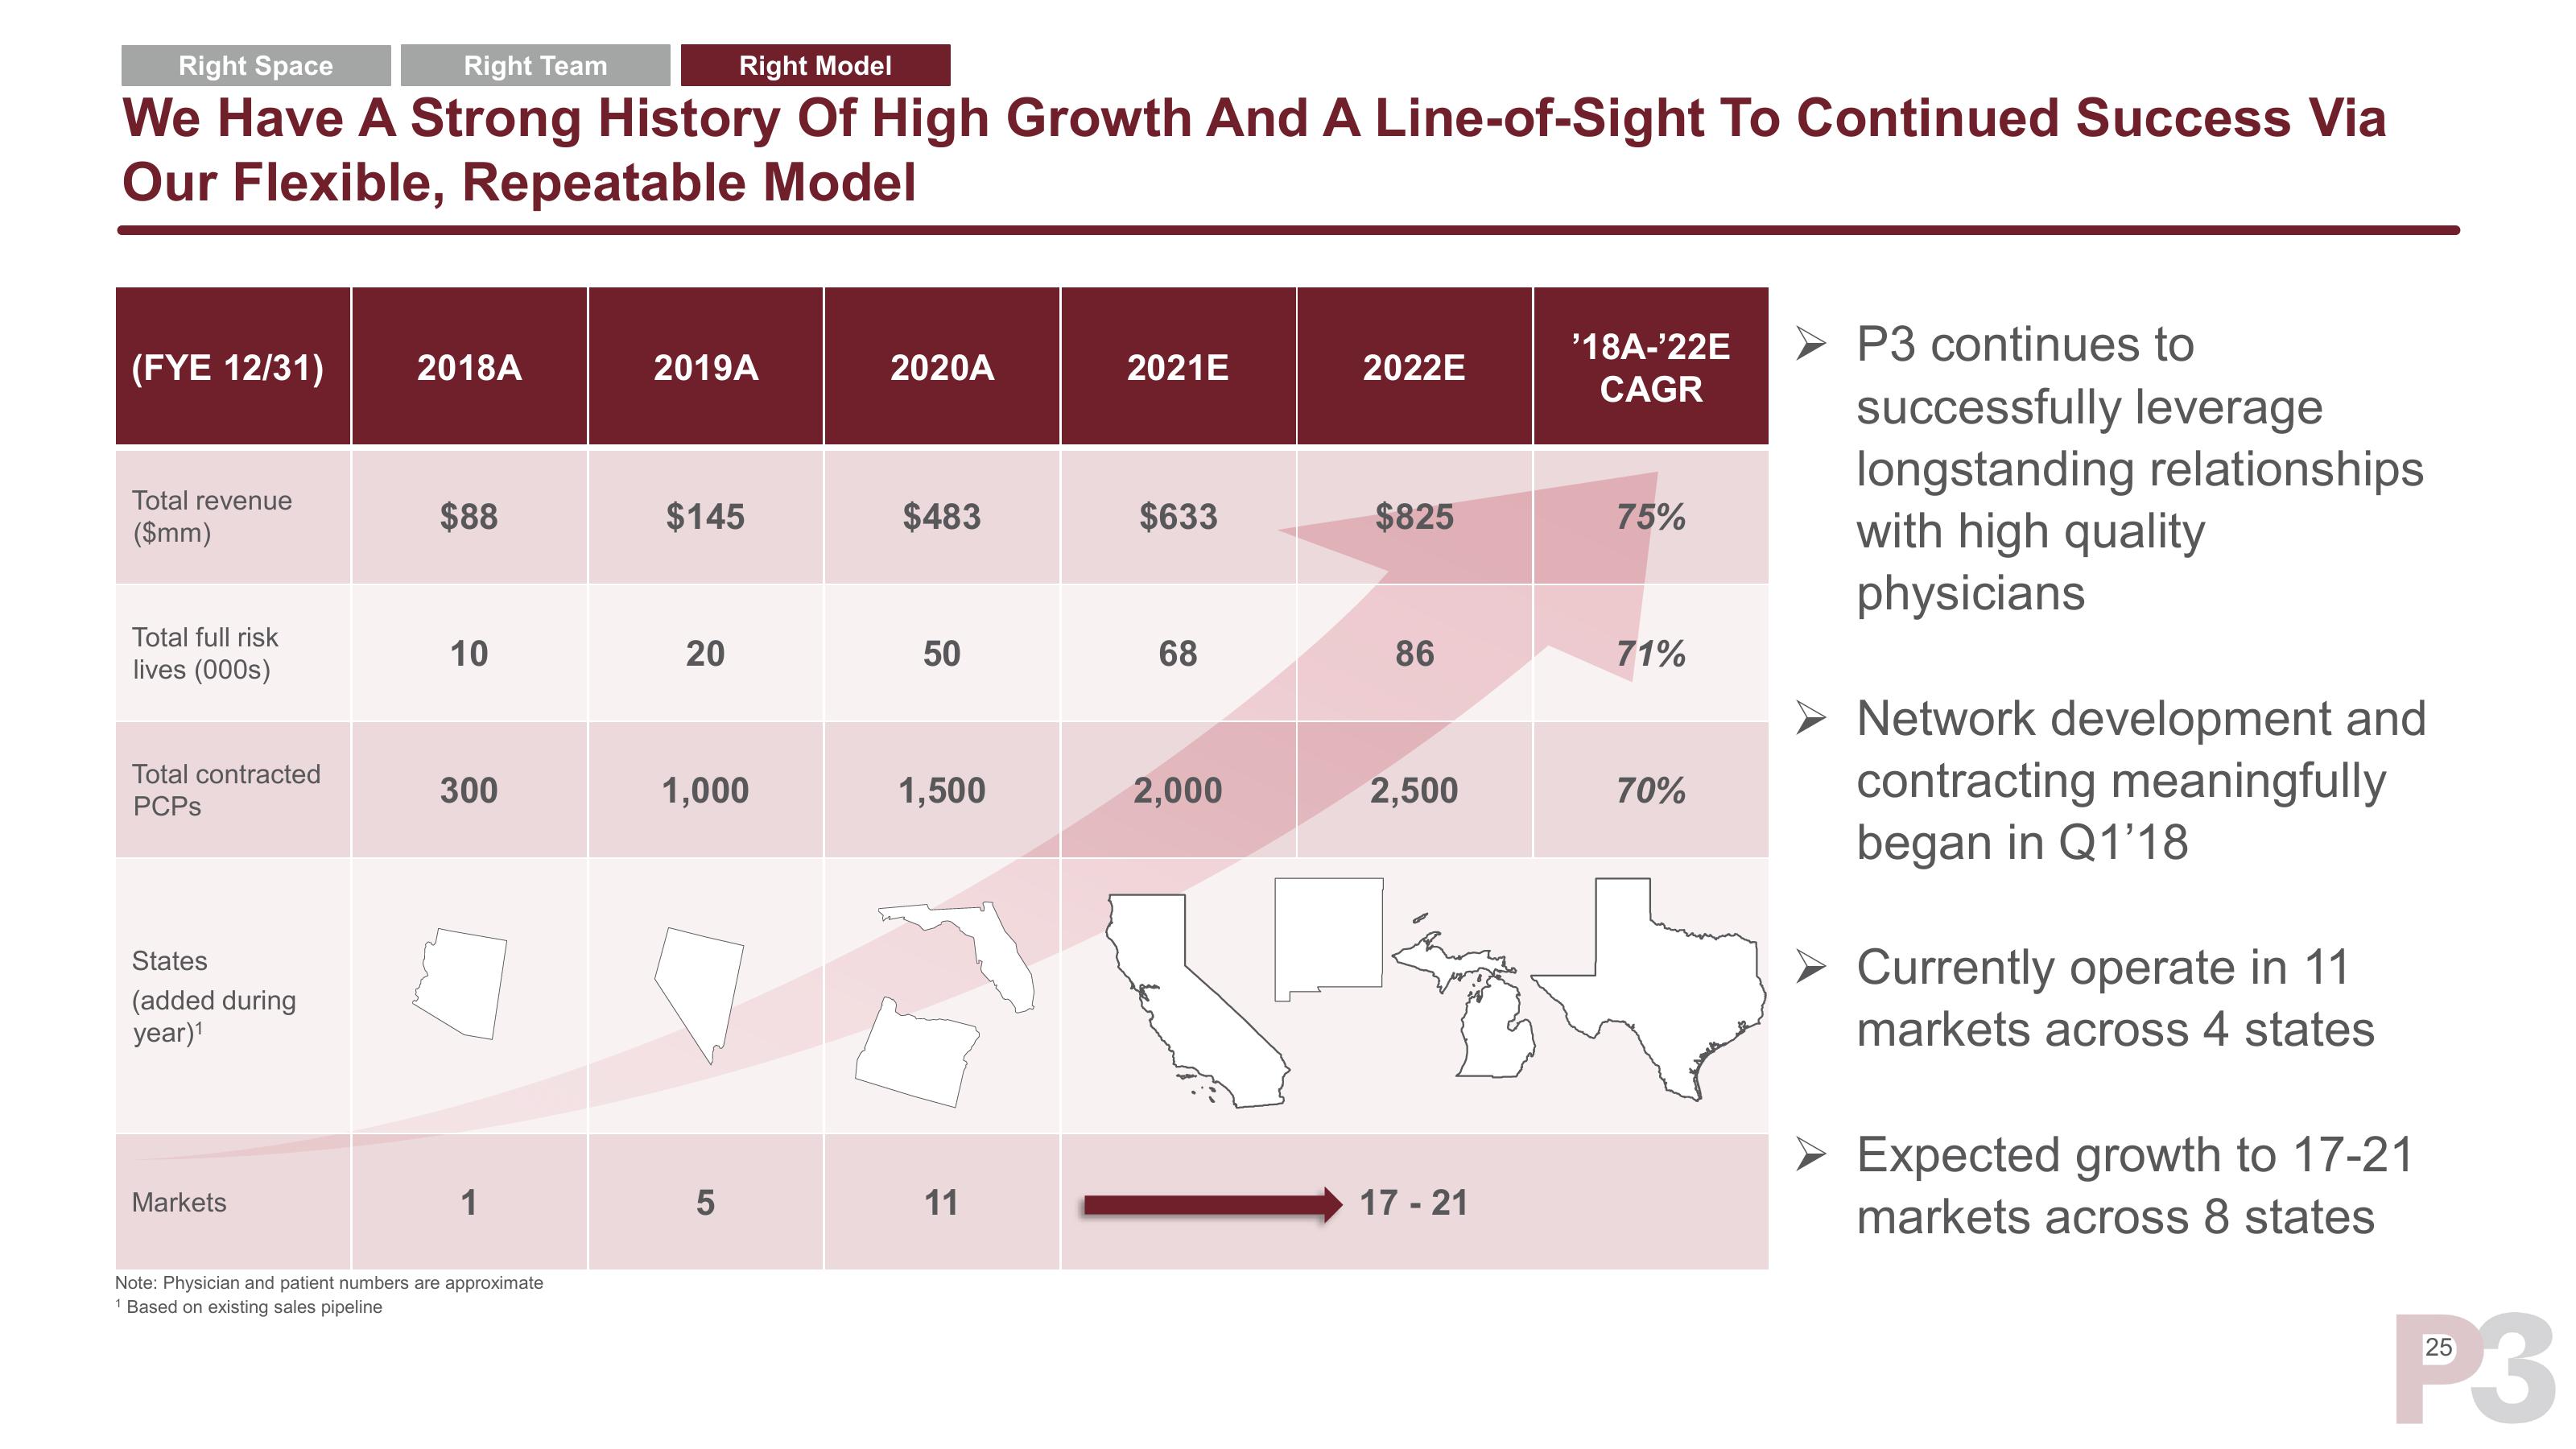
We Have A Strong History Of High Growth And A Line-of-Sight To Continued Success Via
Our Flexible, Repeatable Model
(FYE 12/31)
Total revenue
($mm)
Total full risk
lives (000s)
Total contracted
PCPs
States
(added during
year)¹
Markets
2018A
$88
10
300
1
Note: Physician and patient numbers are approximate
1 Based on existing sales pipeline
2019A
$145
20
1,000
LO
5
2020A
$483
50
1,500
11
2021E
$633
68
2,000
2022E
$825
86
2,500
17-21
'18A-'22E
CAGR
75%
71%
70%
P3 continues to
successfully leverage
longstanding relationships
with high quality
physicians
Network development and
contracting meaningfully
began in Q1'18
Currently operate in 11
markets across 4 states
Expected growth to 17-21
markets across 8 states
25
P3View entire presentation