Gates Investor Day
Gates
Ⓡ
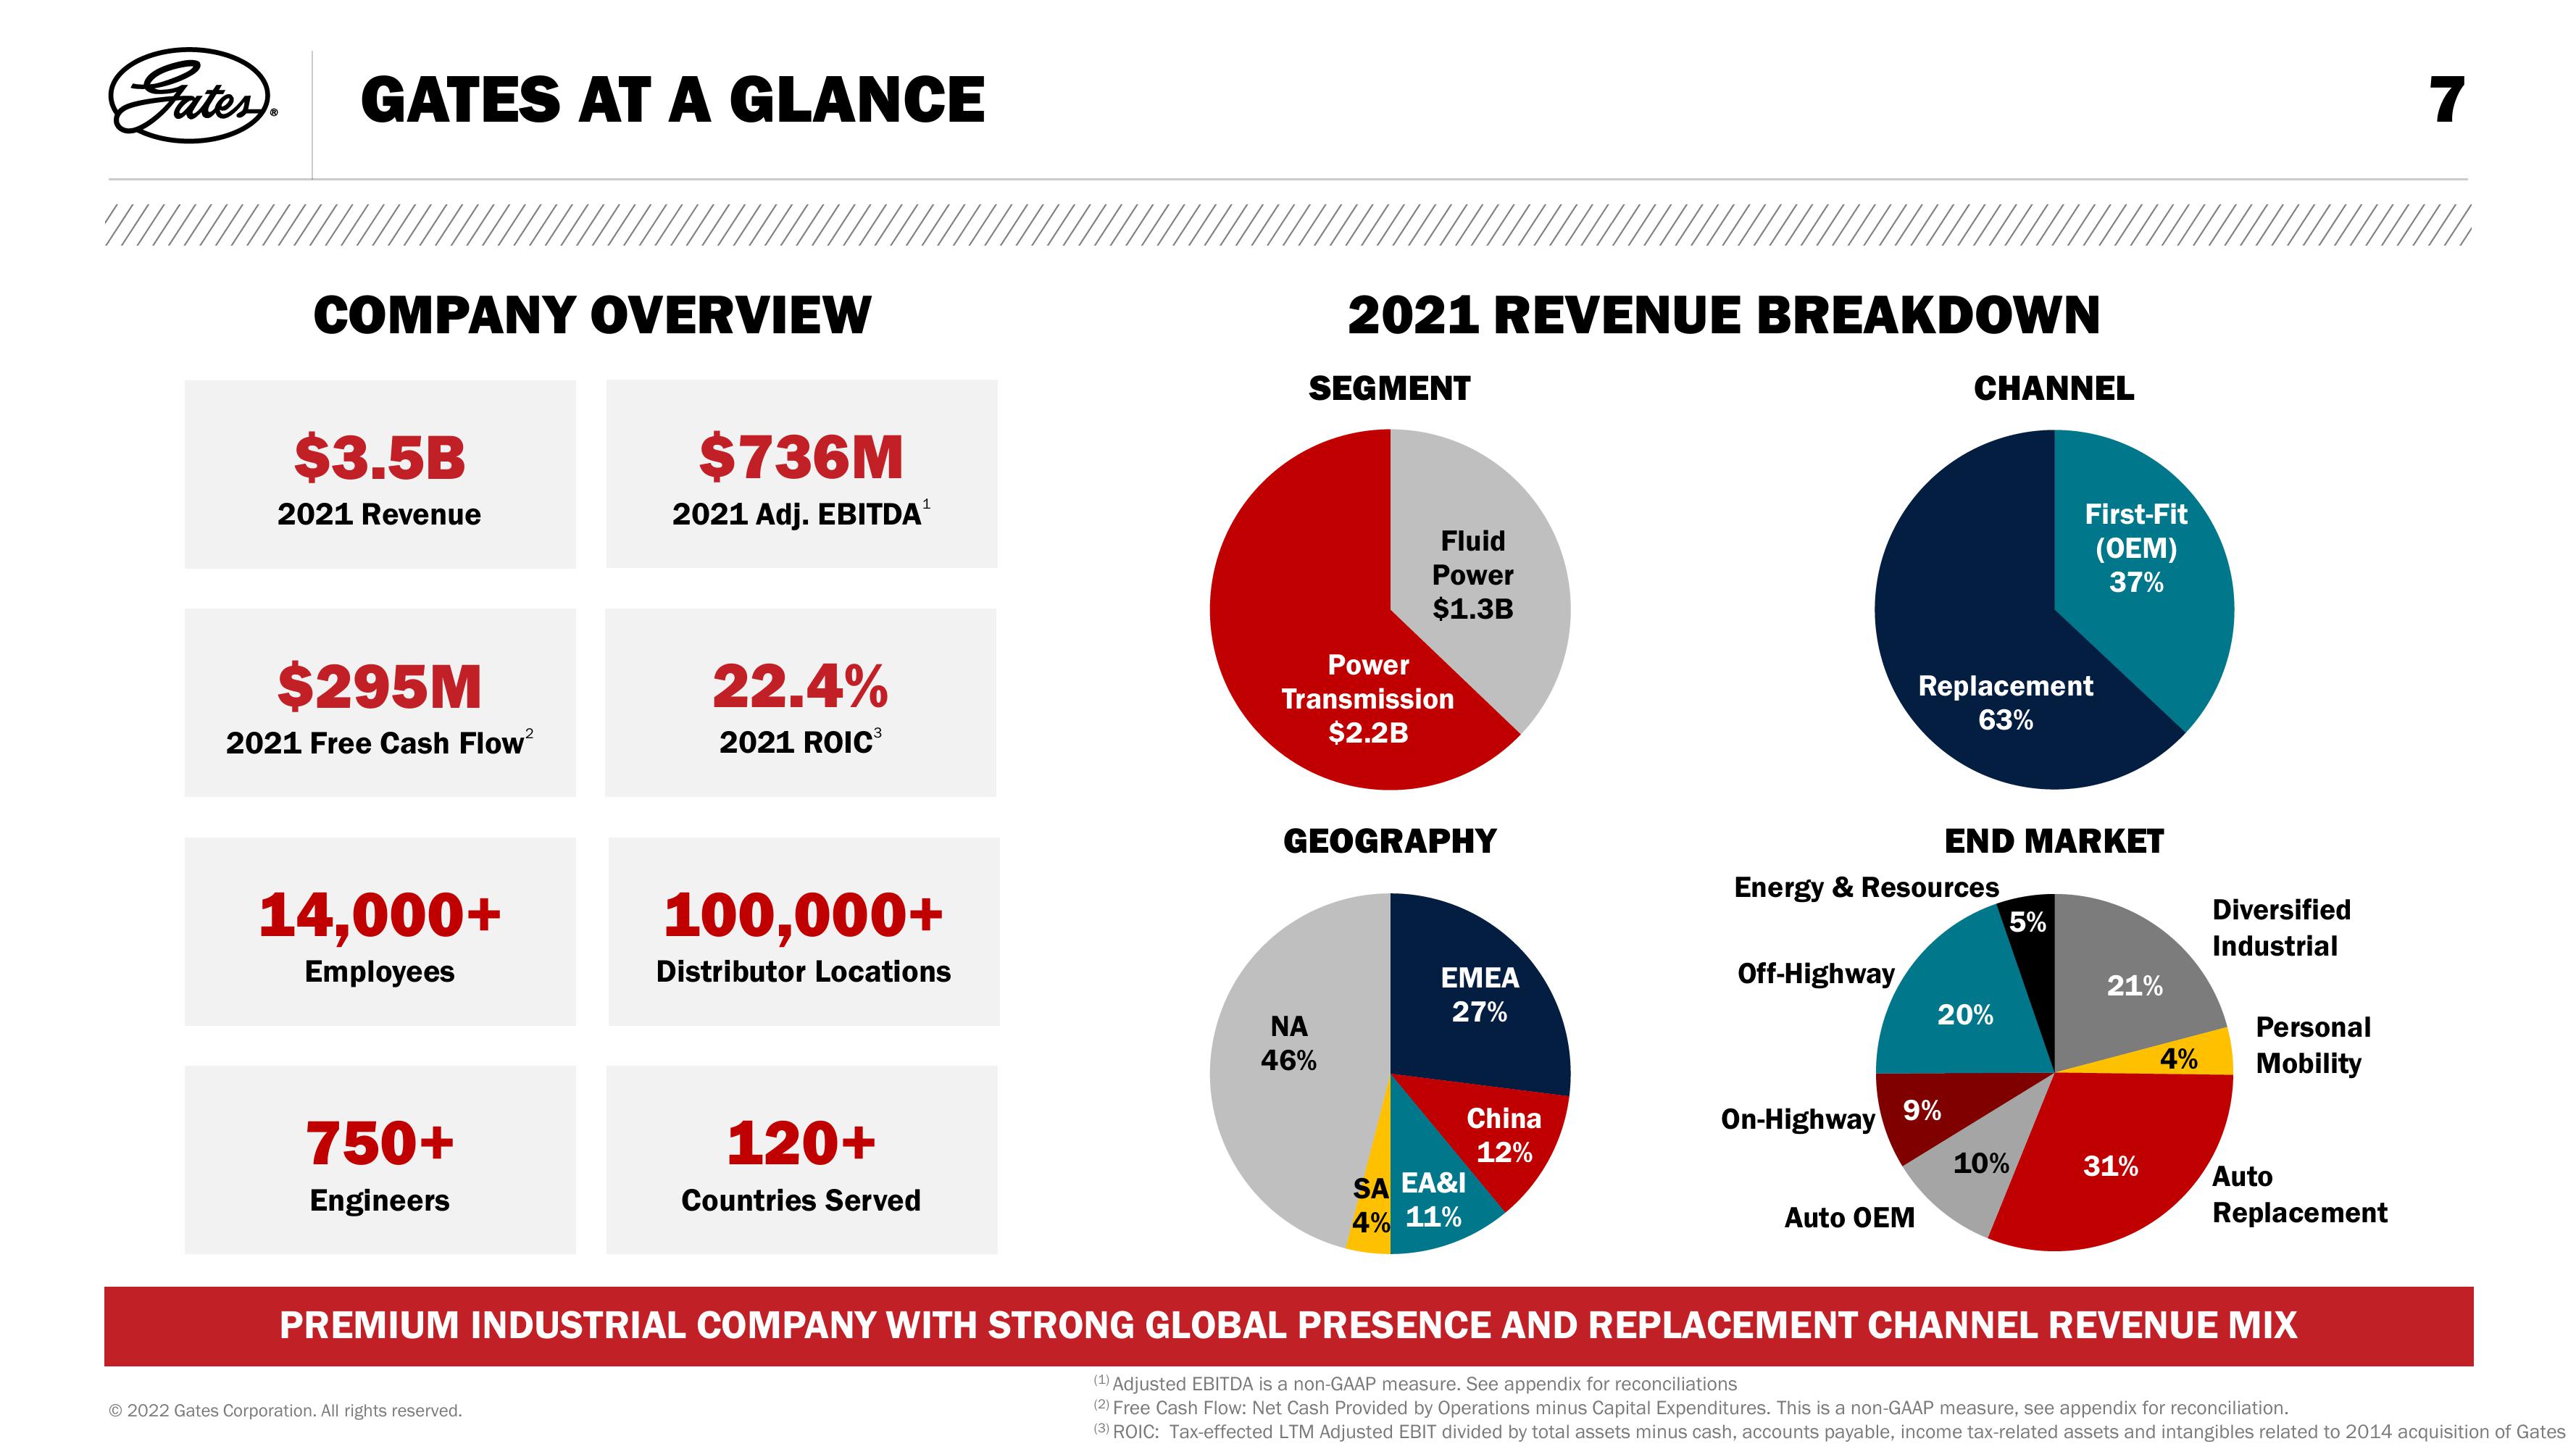
GATES AT A GLANCE
COMPANY OVERVIEW
$3.5B
2021 Revenue
$295M
2021 Free Cash Flow²
14,000+
Employees
750+
Engineers
$736M
2021 Adj. EBITDA¹
Ⓒ2022 Gates Corporation. All rights reserved.
22.4%
2021 ROIC³
100,000+
Distributor Locations
120+
Countries Served
2021 REVENUE BREAKDOWN
SEGMENT
Fluid
Power
$1.3B
Power
Transmission
$2.2B
GEOGRAPHY
ΝΑ
46%
EMEA
27%
SA EA&I
4% 11%
China
12%
Off-Highway
CHANNEL
Energy & Resources
Auto OEM
Replacement
63%
On-Highway 9%
END MARKET
20%
First-Fit
(OEM)
37%
5%
10%
21%
31%
4%
Diversified
Industrial
Personal
Mobility
Auto
Replacement
7
PREMIUM INDUSTRIAL COMPANY WITH STRONG GLOBAL PRESENCE AND REPLACEMENT CHANNEL REVENUE MIX
(1) Adjusted EBITDA is a non-GAAP measure. See appendix for reconciliations
(2) Free Cash Flow: Net Cash Provided by Operations minus Capital Expenditures. This is a non-GAAP measure, see appendix for reconciliation.
(3) ROIC: Tax-effected LTM Adjusted EBIT divided by total assets minus cash, accounts payable, income tax-related assets and intangibles related to 2014 acquisition of GatesView entire presentation