Uber Results Presentation Deck
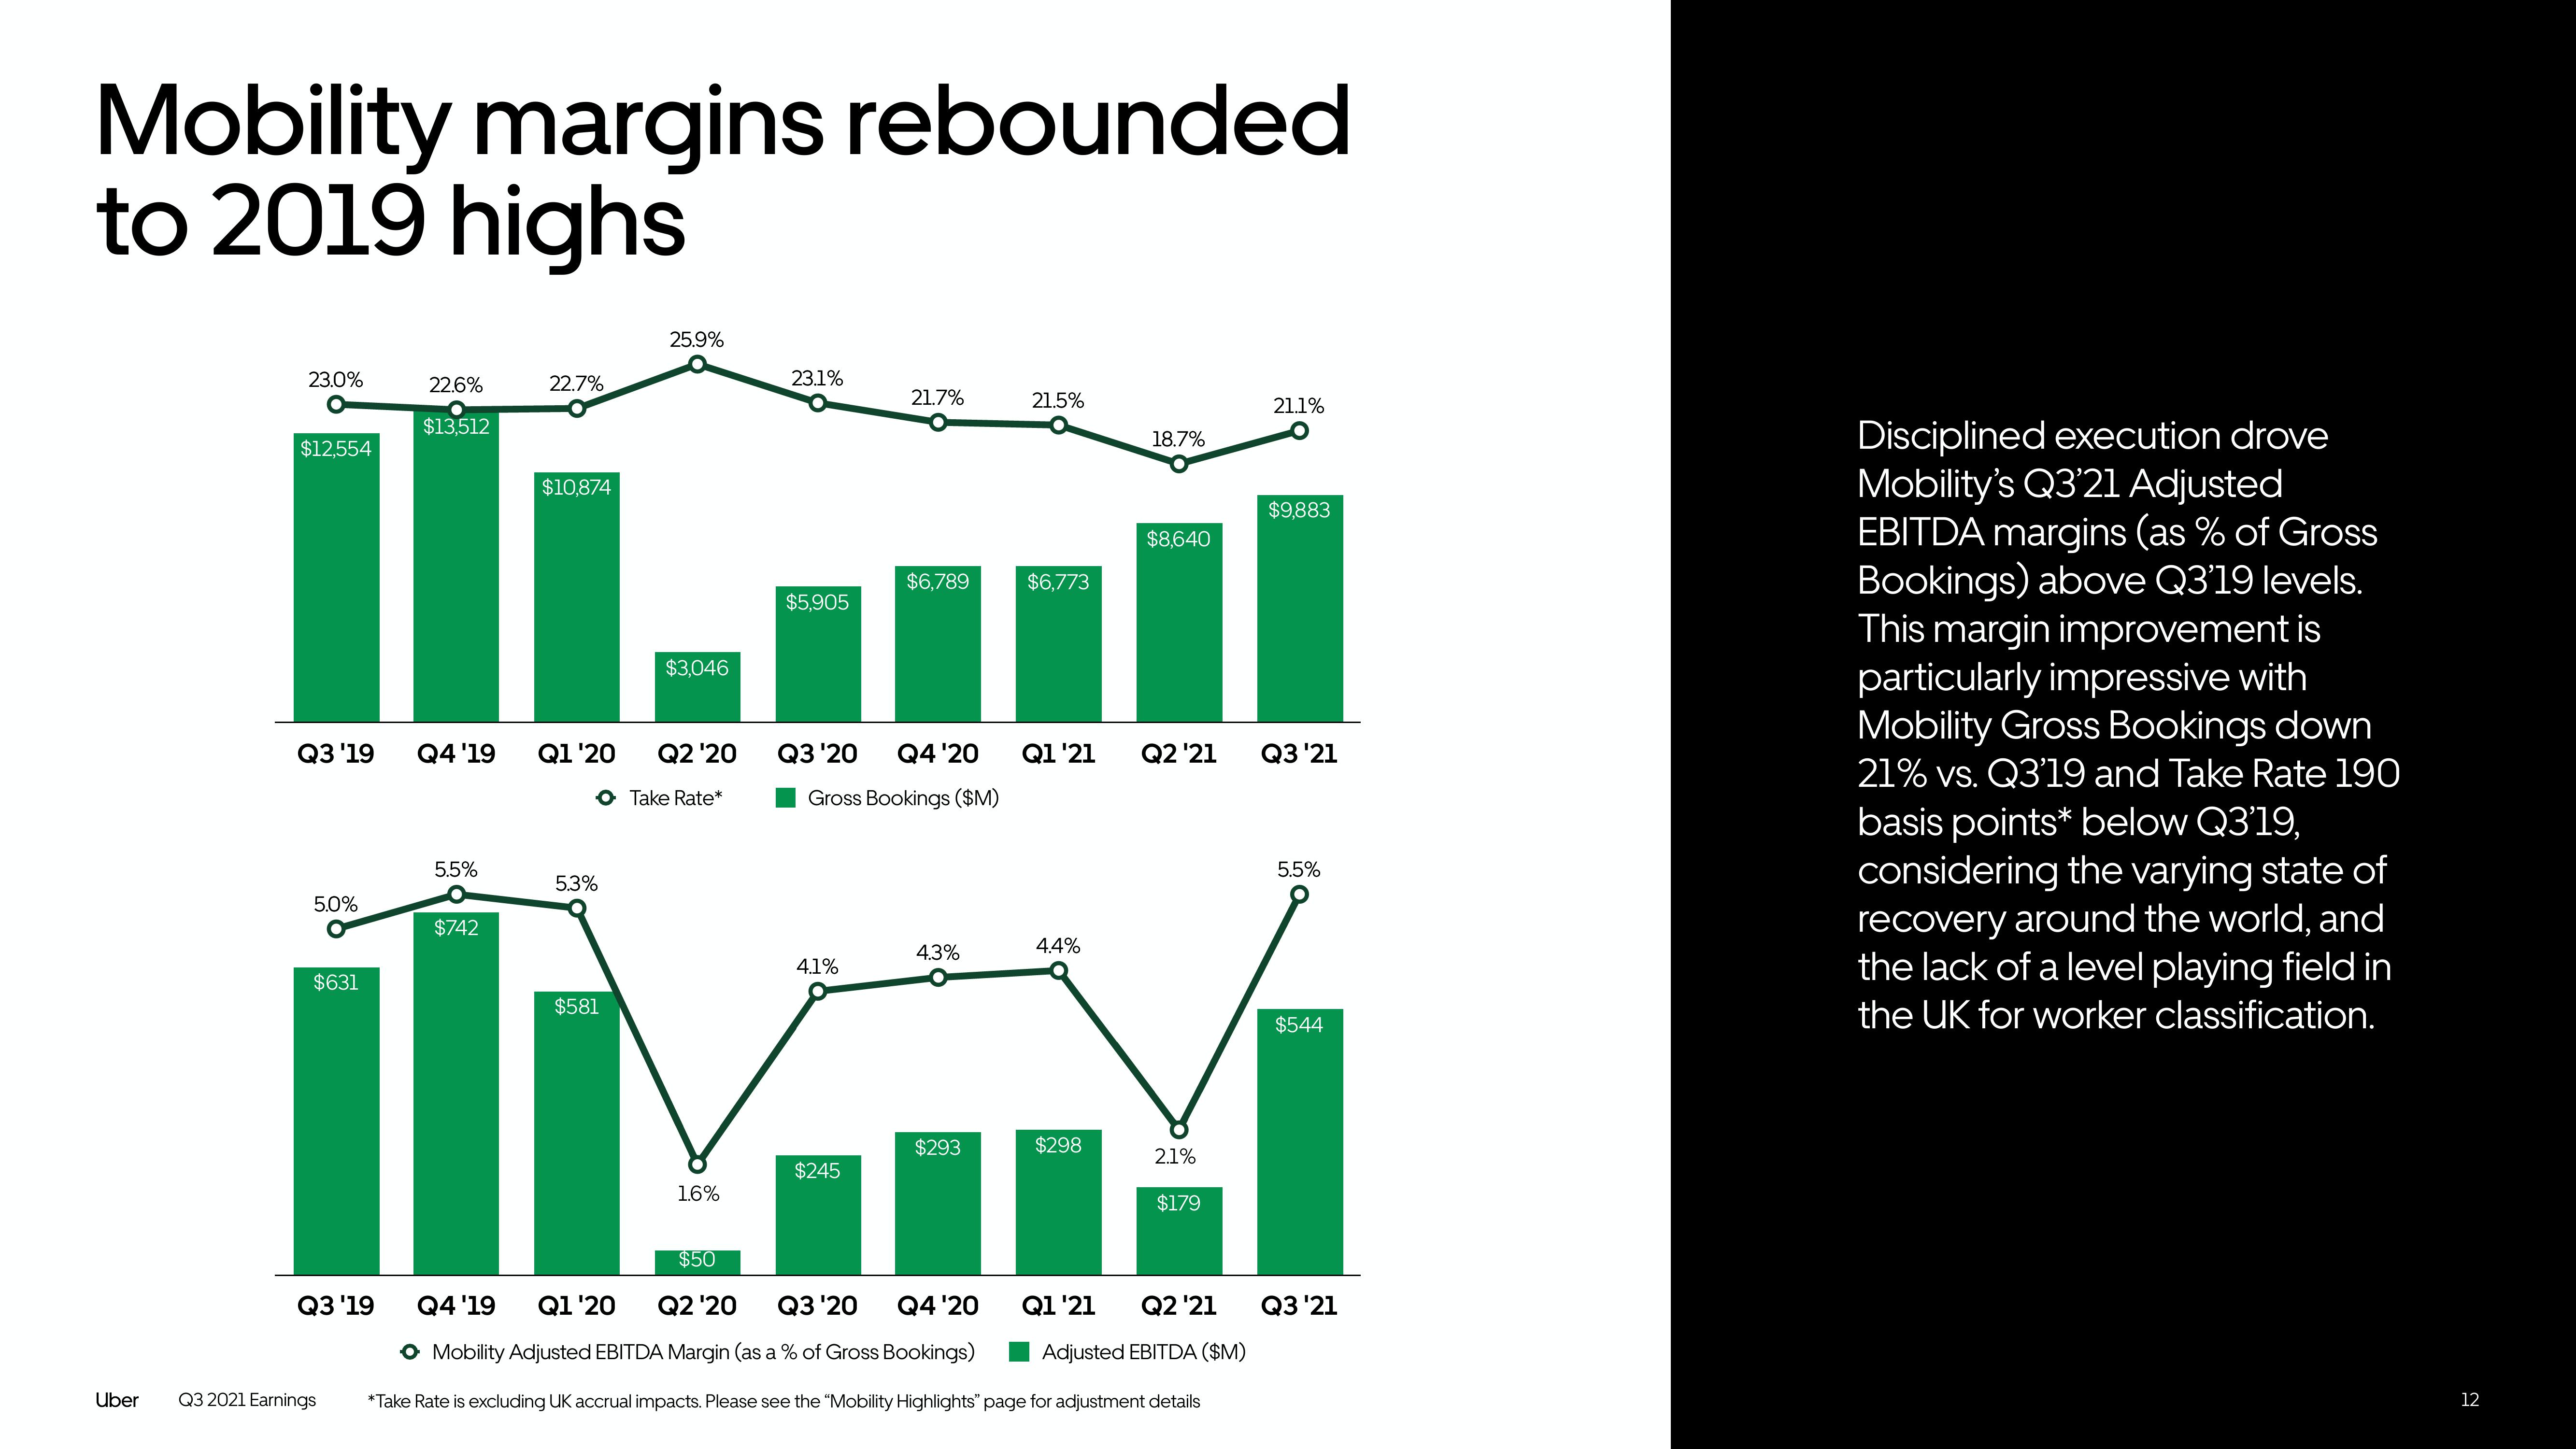
Mobility margins rebounded
to 2019 highs
Uber
23.0%
O
$12,554
Q3 '19
5.0%
$631
22.6%
$13,512
Q3 2021 Earnings
5.5%
Q4 '19 Q1 '20
$742
11
Q3 '19
22.7%
$10,874
5.3%
$581
25.9%
$3,046
Q2 '20
Take Rate*
1.6%
$50
23.1%
$5,905
21.7%
Q3 '20 Q4 '20
4.1%
$6,789
Gross Bookings ($M)
$245
4.3%
$293
21.5%
$6,773
Q1 '21
4.4%
$298
18.7%
$8,640
Q2 '21
2.1%
$179
Q4 '19 Q1 '20 Q2 '20 Q3 '20
Q4 '20
Q1 '21
O Mobility Adjusted EBITDA Margin (as a % of Gross Bookings)
Adjusted EBITDA ($M)
*Take Rate is excluding UK accrual impacts. Please see the "Mobility Highlights" page for adjustment details
21.1%
$9,883
Q3 '21
5.5%
$544
Q2 '21 Q3 '21
Disciplined execution drove
Mobility's Q3'21 Adjusted
EBITDA margins (as % of Gross
Bookings) above Q3'19 levels.
This margin improvement is
particularly impressive with
Mobility Gross Bookings down
21% vs. Q3'19 and Take Rate 190
basis points* below Q3'19,
considering the varying state of
recovery around the world, and
the lack of a level playing field in
the UK for worker classification.
12View entire presentation