Bird Investor Presentation Deck
Strong Q2 financial results
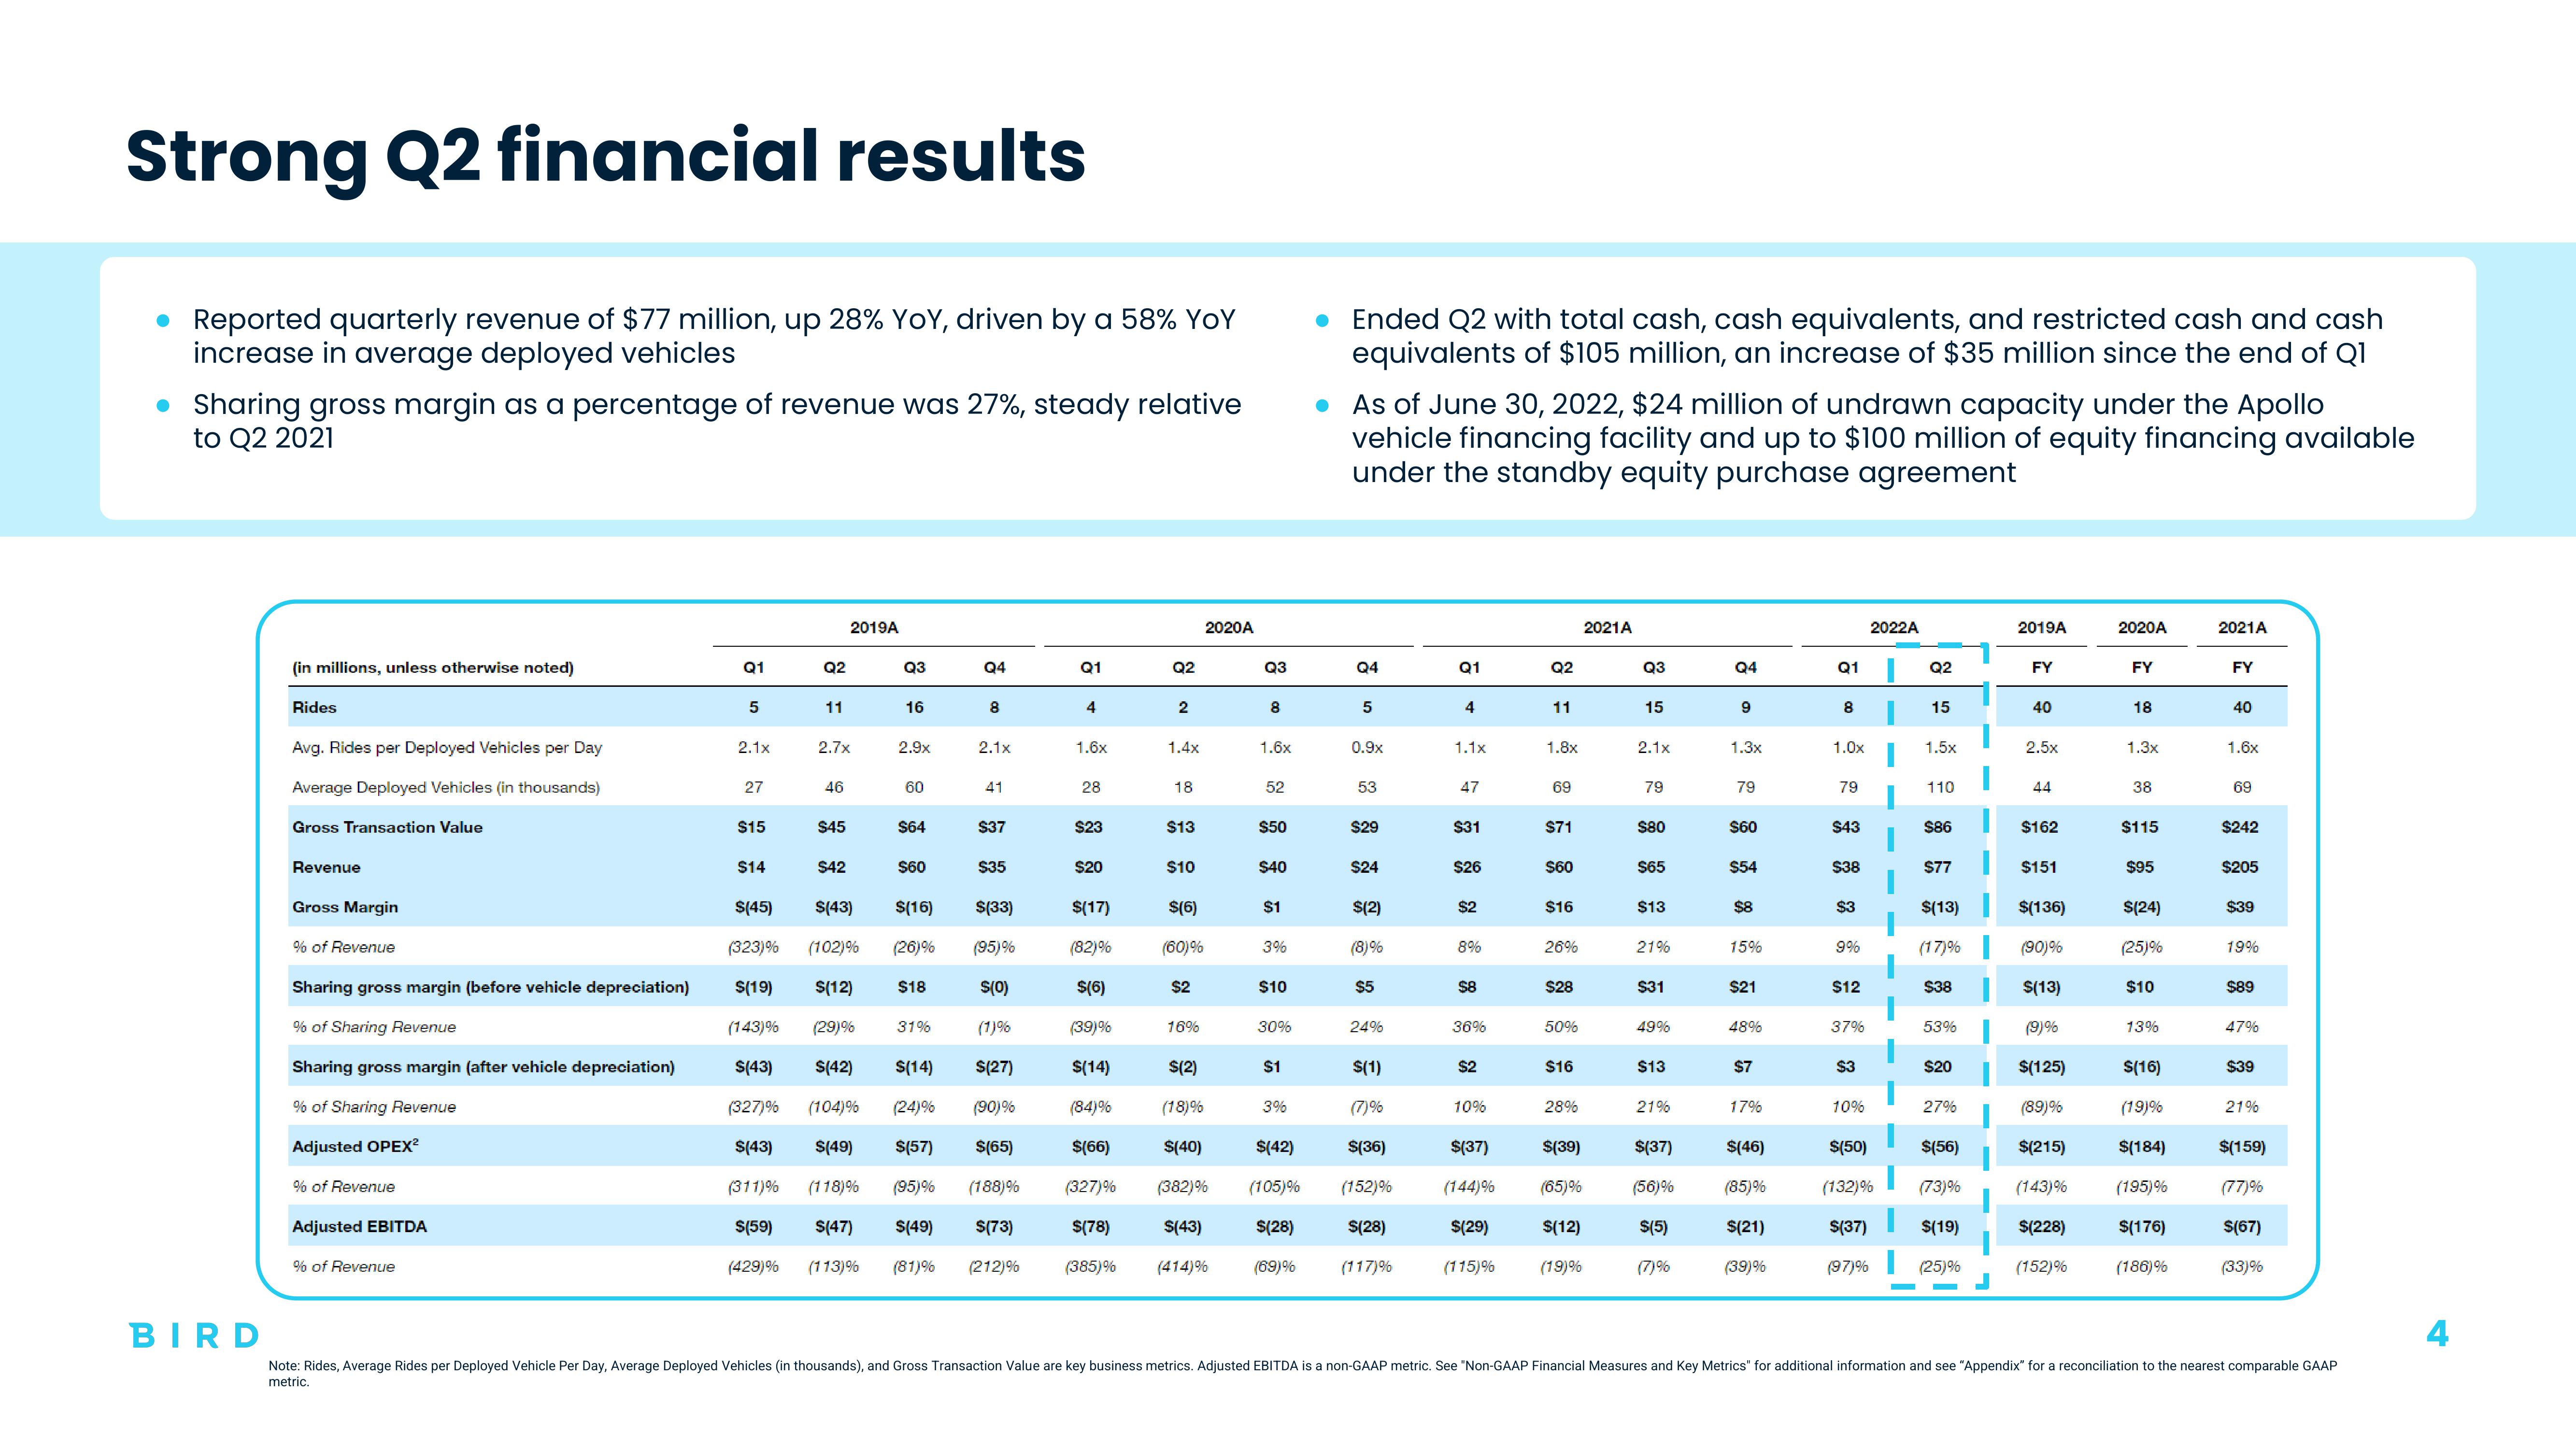
• Reported quarterly revenue of $77 million, up 28% YOY, driven by a 58% YoY
increase in average deployed vehicles
• Sharing gross margin as a percentage of revenue was 27%, steady relative
to Q2 2021
BIRD
(in millions, unless otherwise noted)
Rides
Avg. Rides per Deployed Vehicles per Day
Average Deployed Vehicles (in thousands)
Gross Transaction Value
Revenue
Gross Margin
% of Revenue
Sharing gross margin (before vehicle depreciation)
% of Sharing Revenue
Sharing gross margin (after vehicle depreciation)
% of Sharing Revenue
Adjusted OPEX²
% of Revenue
Adjusted EBITDA
% of Revenue
Q1
5
2.1x
27
$15
$14
Q2
11
2.7x
46
$45
2019A
$42
Q3
16
2.9x
60
$64
$60
$(45) $(43)
(323)%
S(19) $(12)
(143)%
(29)%
S(43) $(42) $(14)
(327)%
(104)% (24)%
S(43) $(49) $(57)
(311)% (118)% (95)%
$(59)
S(47) $(49)
(429)% (113)% (81)%
$(16)
(102)% (26)%
$18
31%
04
8
2.1x
41
$37
$35
$(33)
(95)%
$(0)
(1)%
$(27)
(90)%
$(65)
(188)%
$(73)
(212)%
Q1
4
1.6x
28
$23
$20
92
2
1.4x
18
$13
$10
$(6)
(60)%
$(17)
(82)%
$(6)
(39)%
$(14)
$(2)
(84)%
(18)%
$(66)
$(40)
(327)%
(382)%
$(78) $(43)
(385)% (414)%
$2
2020A
16%
Q3
8
1.6x
52
$50
$40
$1
3%
$10
30%
$1
3%
$(42)
(105)%
$(28)
(69)%
● Ended Q2 with total cash, cash equivalents, and restricted cash and cash
equivalents of $105 million, an increase of $35 million since the end of Q1
● As of June 30, 2022, $24 million of undrawn capacity under the Apollo
vehicle financing facility and up to $100 million of equity financing available
under the standby equity purchase agreement
Q4
5
0.9x
53
$29
$24
$(2)
(8)%
$5
24%
$(1)
(7)%
S(36)
(152)%
$(28)
(117)%
Q1
4
1.1x
47
$31
$26
$2
8%
S8
36%
$2
10%
$(37)
(144)%
$(29)
(115)%
Q2
11
1.8x
69
$71
$60
$16
26%
$28
50%
$16
28%
$(39)
(65)%
S(12)
(19)%
2021A
Q3
15
2.1x
79
$80
$65
$13
21%
$31
49%
$13
21%
$(37)
(56)%
S(5)
(7)%
Q4
9
1.3x
79
$60
$54
$8
15%
$21
%687
$7
17%
$(46)
(85)%
$(21)
(39)%
Q1
8
1.0x
79
$43
$38
$3
9%
$12
37%
$3
10%
2022A
Q2
15
1.5x
110
$86
$77
$(13)
(17)%
$38
53%
$20
27%
$(50)
$(56)
(132)% (73)%
$(19)
$(37)
(97)%
(25)%
2019A
FY
40
2.5x
44
$162
$151
$(136)
(90)%
$(13)
(9)%
$(125)
(89)%
$(215)
(143)%
$(228)
(152)%
2020A
FY
18
1.3x
38
$115
$95
$(24)
(25)%
$10
13%
S(16)
(19)%
$(184)
(195)%
$(176)
(186)%
2021A
FY
40
1.6x
69
$242
$205
$39
19%
$89
47%
$39
21%
$(159)
(77)%
S(67)
(33)%
Note: Rides, Average Rides per Deployed Vehicle Per Day, Average Deployed Vehicles (in thousands), and Gross Transaction Value are key business metrics. Adjusted EBITDA is a non-GAAP metric. See "Non-GAAP Financial Measures and Key Metrics" for additional information and see "Appendix" for a reconciliation to the nearest comparable GAAP
metric.View entire presentation