J.P.Morgan Results Presentation Deck
Commercial Banking1
SELECTED INCOME STATEMENT DATA ($MM)
Revenue
Middle Market Banking
Corporate Client Banking
Commercial Real Estate Banking
Other
Expense
Credit costs
Net income
Average equity
ROE
Overhead ratio
Payments revenue ($mm) ³
Investment Banking and Markets
revenue, gross ($mm)4
5
Average loans
Average client deposits
Allowance for loan losses
Nonaccrual loans
Net charge-off/(recovery) rate
ALL/loans
Reported
$3,988
1,916
KEY DRIVERS / STATISTICS ($B)²
1 See note 1 on slide 11
For additional footnotes see slide 13.
1,229
806
JPMORGAN CHASE & CO.
37
1,300
1,097
$1,208
Reported
$29.5
16%
33
$2,248
$767
270.8
275.2
4.7
1.1
0.15%
1.68
2Q23
FR impact
$178
48
130
608
($327)
2Q23
FR impact
$1.0
(5)%
(2)
28.6
0.6
0.0
(0.02)%
(0.04)
ex. FR
$3,810
1,868
1,229
676
37
1,300
489
$1,534
ex. FR
$28.5
21%
34
$2,248
$767
242.2
275.2
4.2
1.0
0.17%
1.72
ex. FR $ 0/(U)
1Q23
$299
187
53
34
25
(8)
72
$187
ex. FR
1Q 23
$28.5
18%
37
$2,028
$881
2Q22
$1,127
238.0
266.0
3.6
0.9
0.06%
1.49
699
302
86
40
144
280
$540
2Q22
$25.0
15%
43
$1,253
$788
219.5
300.4
2.6
0.8
0.00%
1.16
CCB
CIB
CB
AWM Corp.
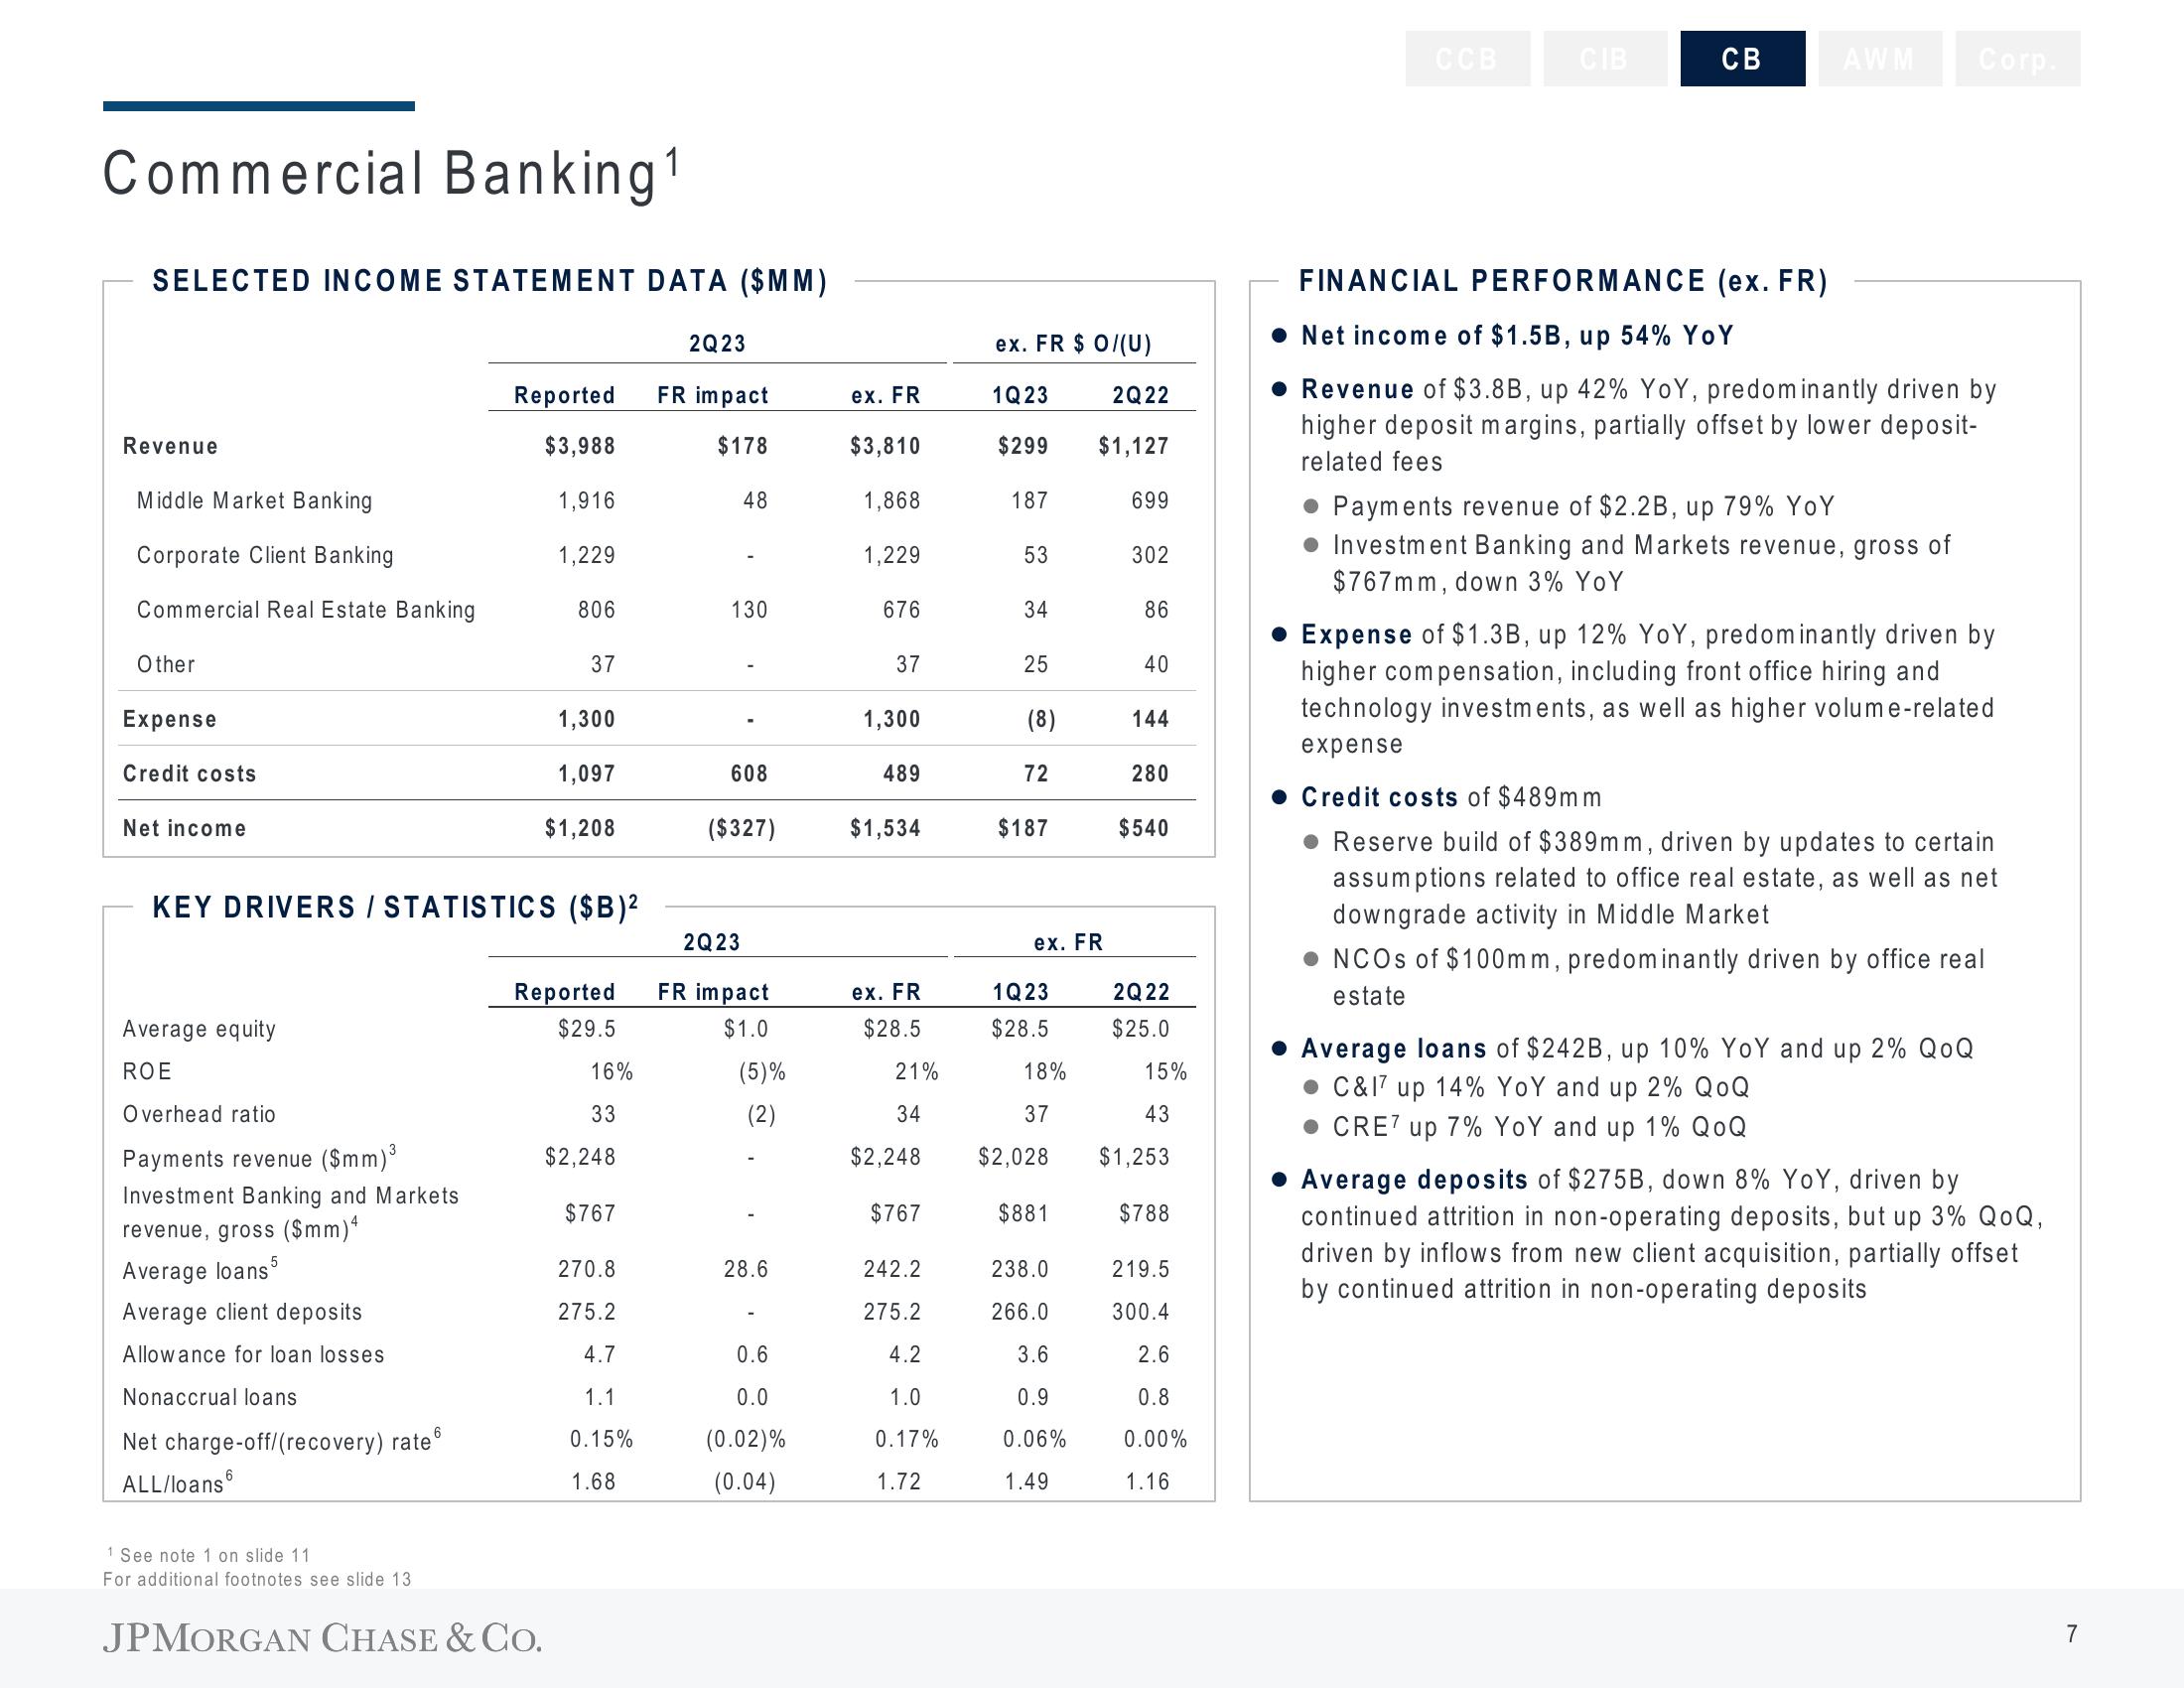
FINANCIAL PERFORMANCE (ex. FR)
• Net income of $1.5B, up 54% YoY
• Revenue of $3.8B, up 42% YoY, predominantly driven by
higher deposit margins, partially offset by lower deposit-
related fees
Payments revenue of $2.2B, up 79% YoY
Investment Banking and Markets revenue, gross of
$767mm, down 3% YoY
• Expense of $1.3B, up 12% YoY, predominantly driven by
higher compensation, including front office hiring and
technology investments, as well as higher volume-related
expense
Credit costs of $489mm
• Reserve build of $389mm, driven by updates to certain
assumptions related to office real estate, as well as net
downgrade activity in Middle Market
• NCOs of $100mm, predominantly driven by office real
estate
Average loans of $242B, up 10% YoY and up 2% QoQ
C&I7 up 14% YoY and up 2% QOQ
● CRE7 up 7% YoY and up 1% QOQ
Average deposits of $275B, down 8% YoY, driven by
continued attrition in non-operating deposits, but up 3% QOQ,
driven by inflows from new client acquisition, partially offset
by continued attrition in non-operating deposits
7View entire presentation