Inovalon Results Presentation Deck
Full Year 2020 Financial Guidance
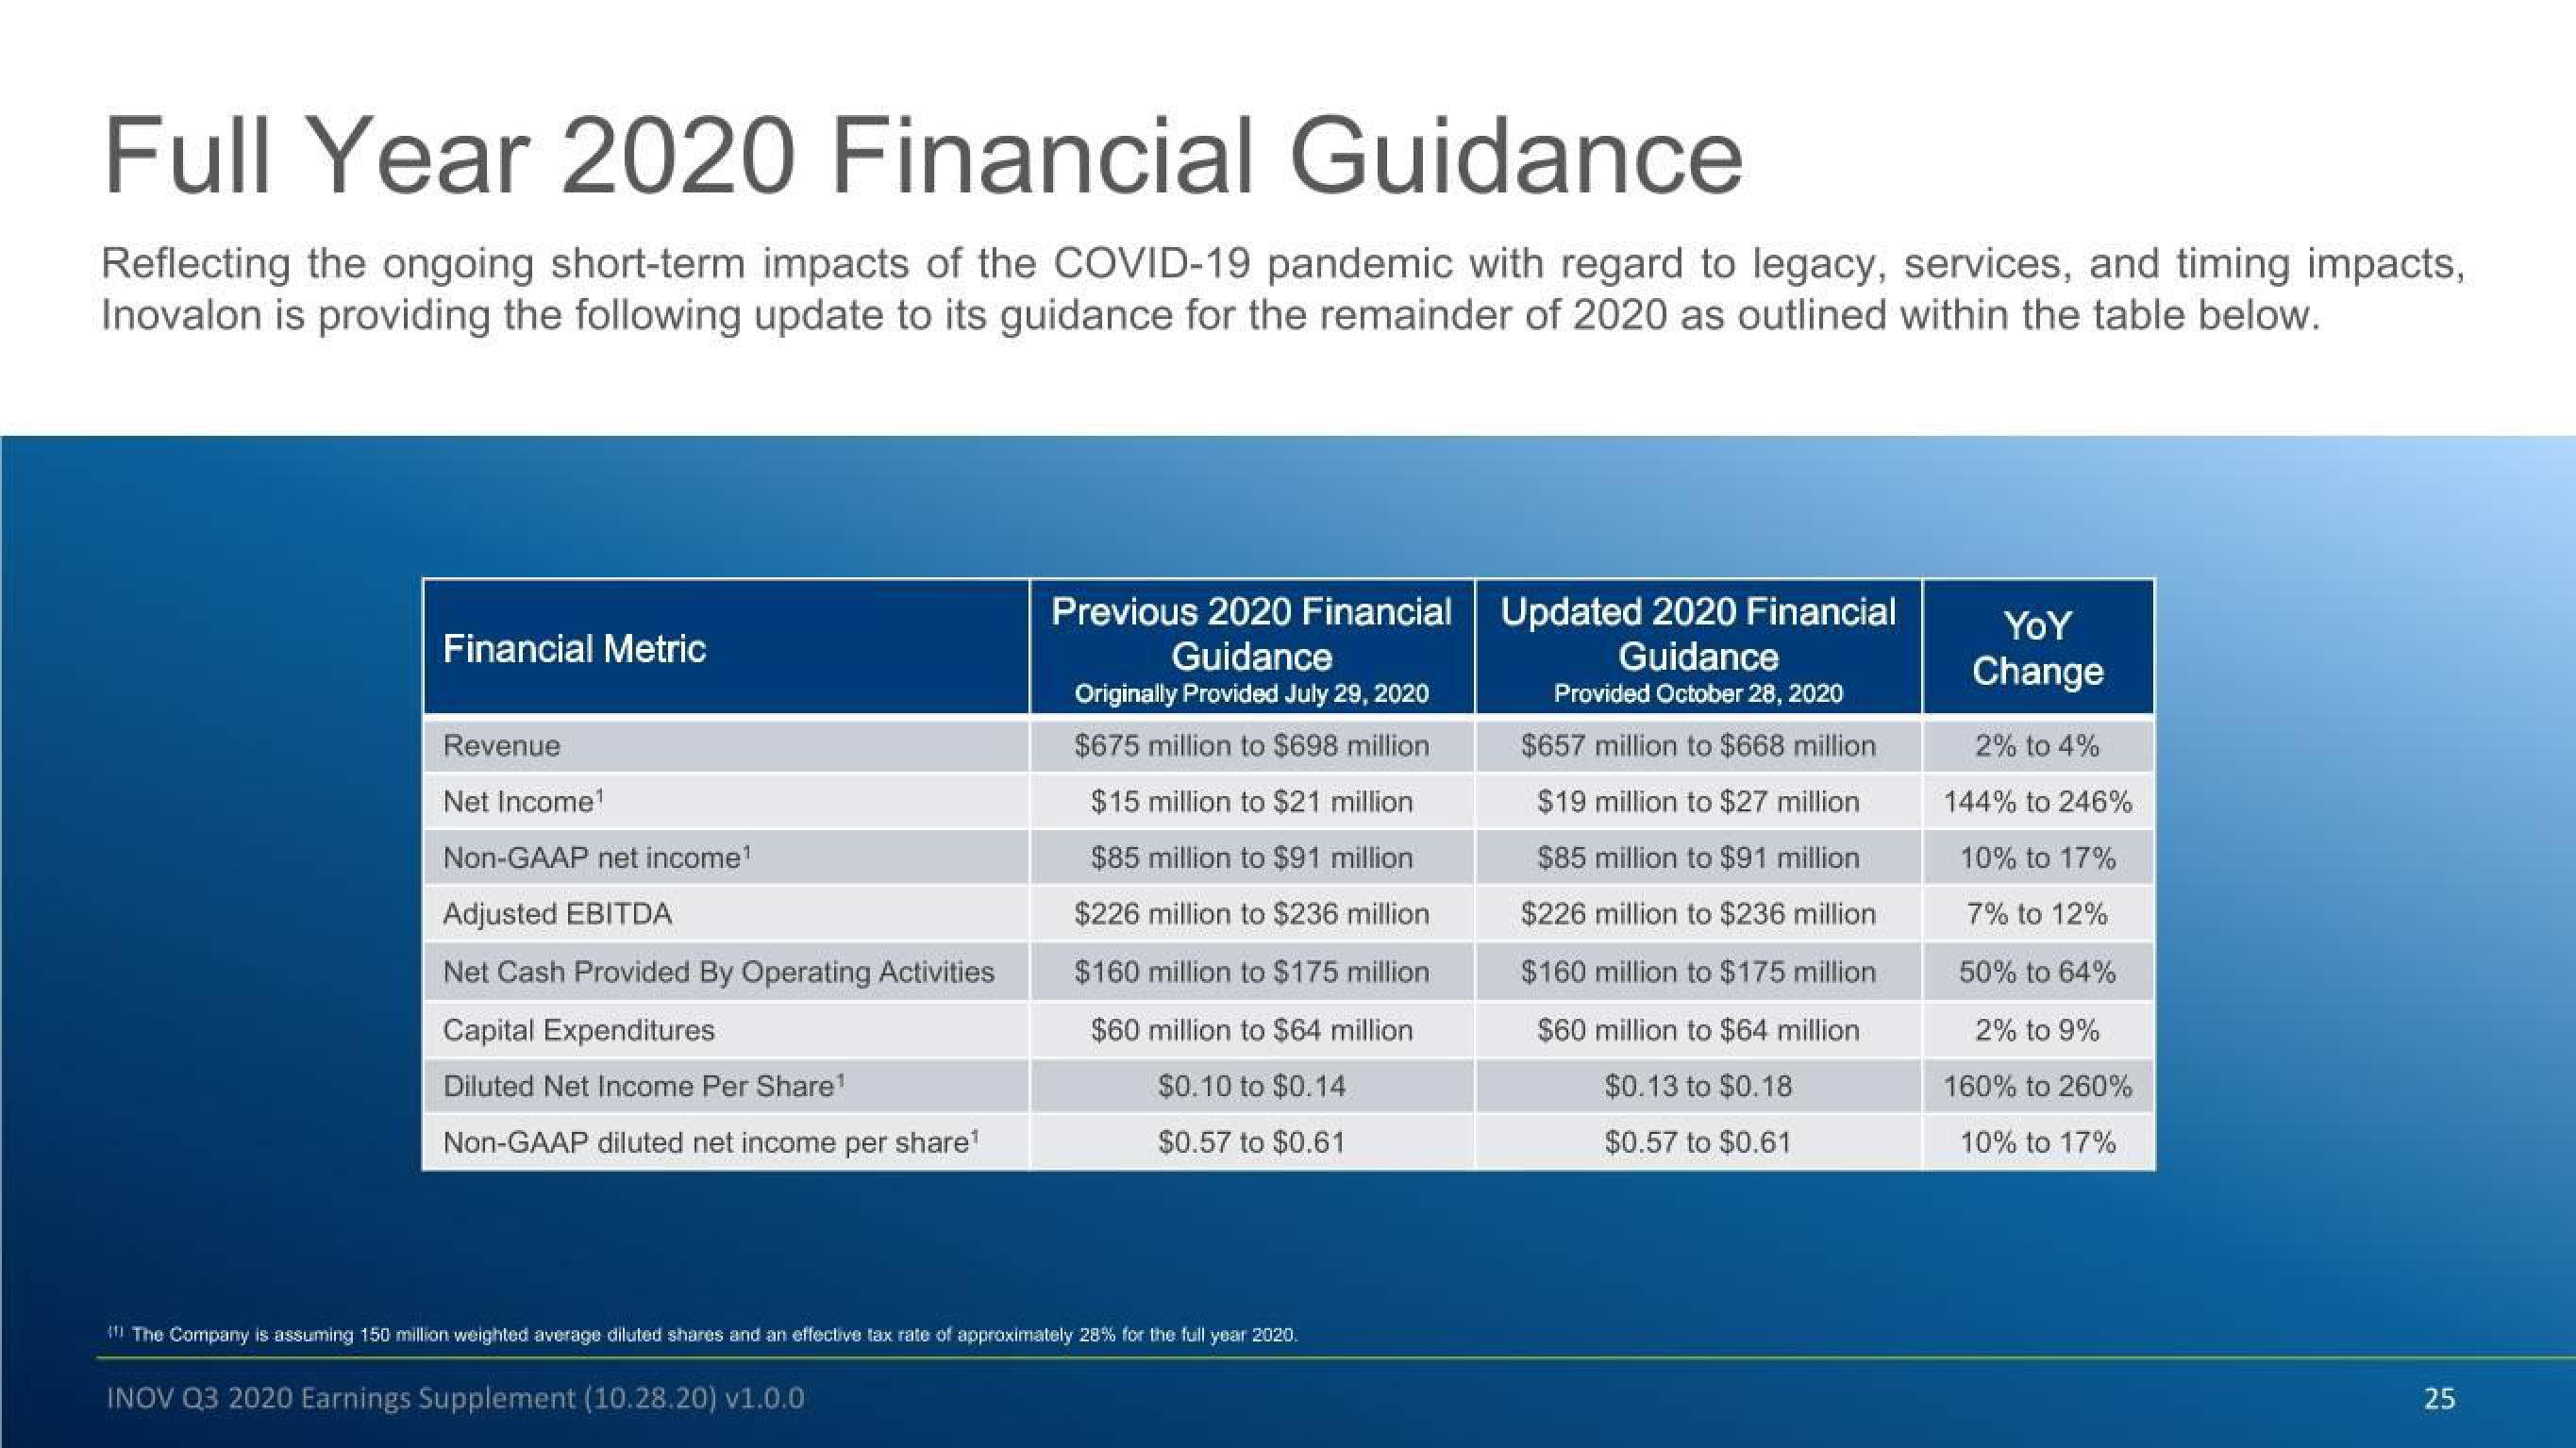
Reflecting the ongoing short-term impacts of the COVID-19 pandemic with regard to legacy, services, and timing impacts,
Inovalon is providing the following update to its guidance for the remainder of 2020 as outlined within the table below.
Financial Metric
Revenue
Net Income¹
Non-GAAP net income¹
Adjusted EBITDA
Net Cash Provided By Operating Activities
Capital Expenditures
Diluted Net Income Per Share¹
Non-GAAP diluted net income per share¹
Previous 2020 Financial
Guidance
Originally Provided July 29, 2020
$675 million to $698 million
$15 million to $21 million
$85 million to $91 million
$226 million to $236 million
$160 million to $175 million
$60 million to $64 million
$0.10 to $0.14
$0.57 to $0.61
The Company is assuming 150 million weighted average diluted shares and an effective tax rate of approximately 28% for the full year 2020.
INOV Q3 2020 Earnings Supplement (10.28.20) v1.0.0
Updated 2020 Financial
Guidance
Provided October 28, 2020
$657 million to $668 million
$19 million to $27 million
$85 million to $91 million
$226 million to $236 million
$160 million to $175 million
$60 million to $64 million
$0.13 to $0.18
$0.57 to $0.61
YoY
Change
2% to 4%
144% to 246%
10% to 17%
7% to 12%
50% to 64%
2% to 9%
160% to 260%
10% to 17%
25View entire presentation