Covalto SPAC Presentation Deck
Financial Performance
& Outlook
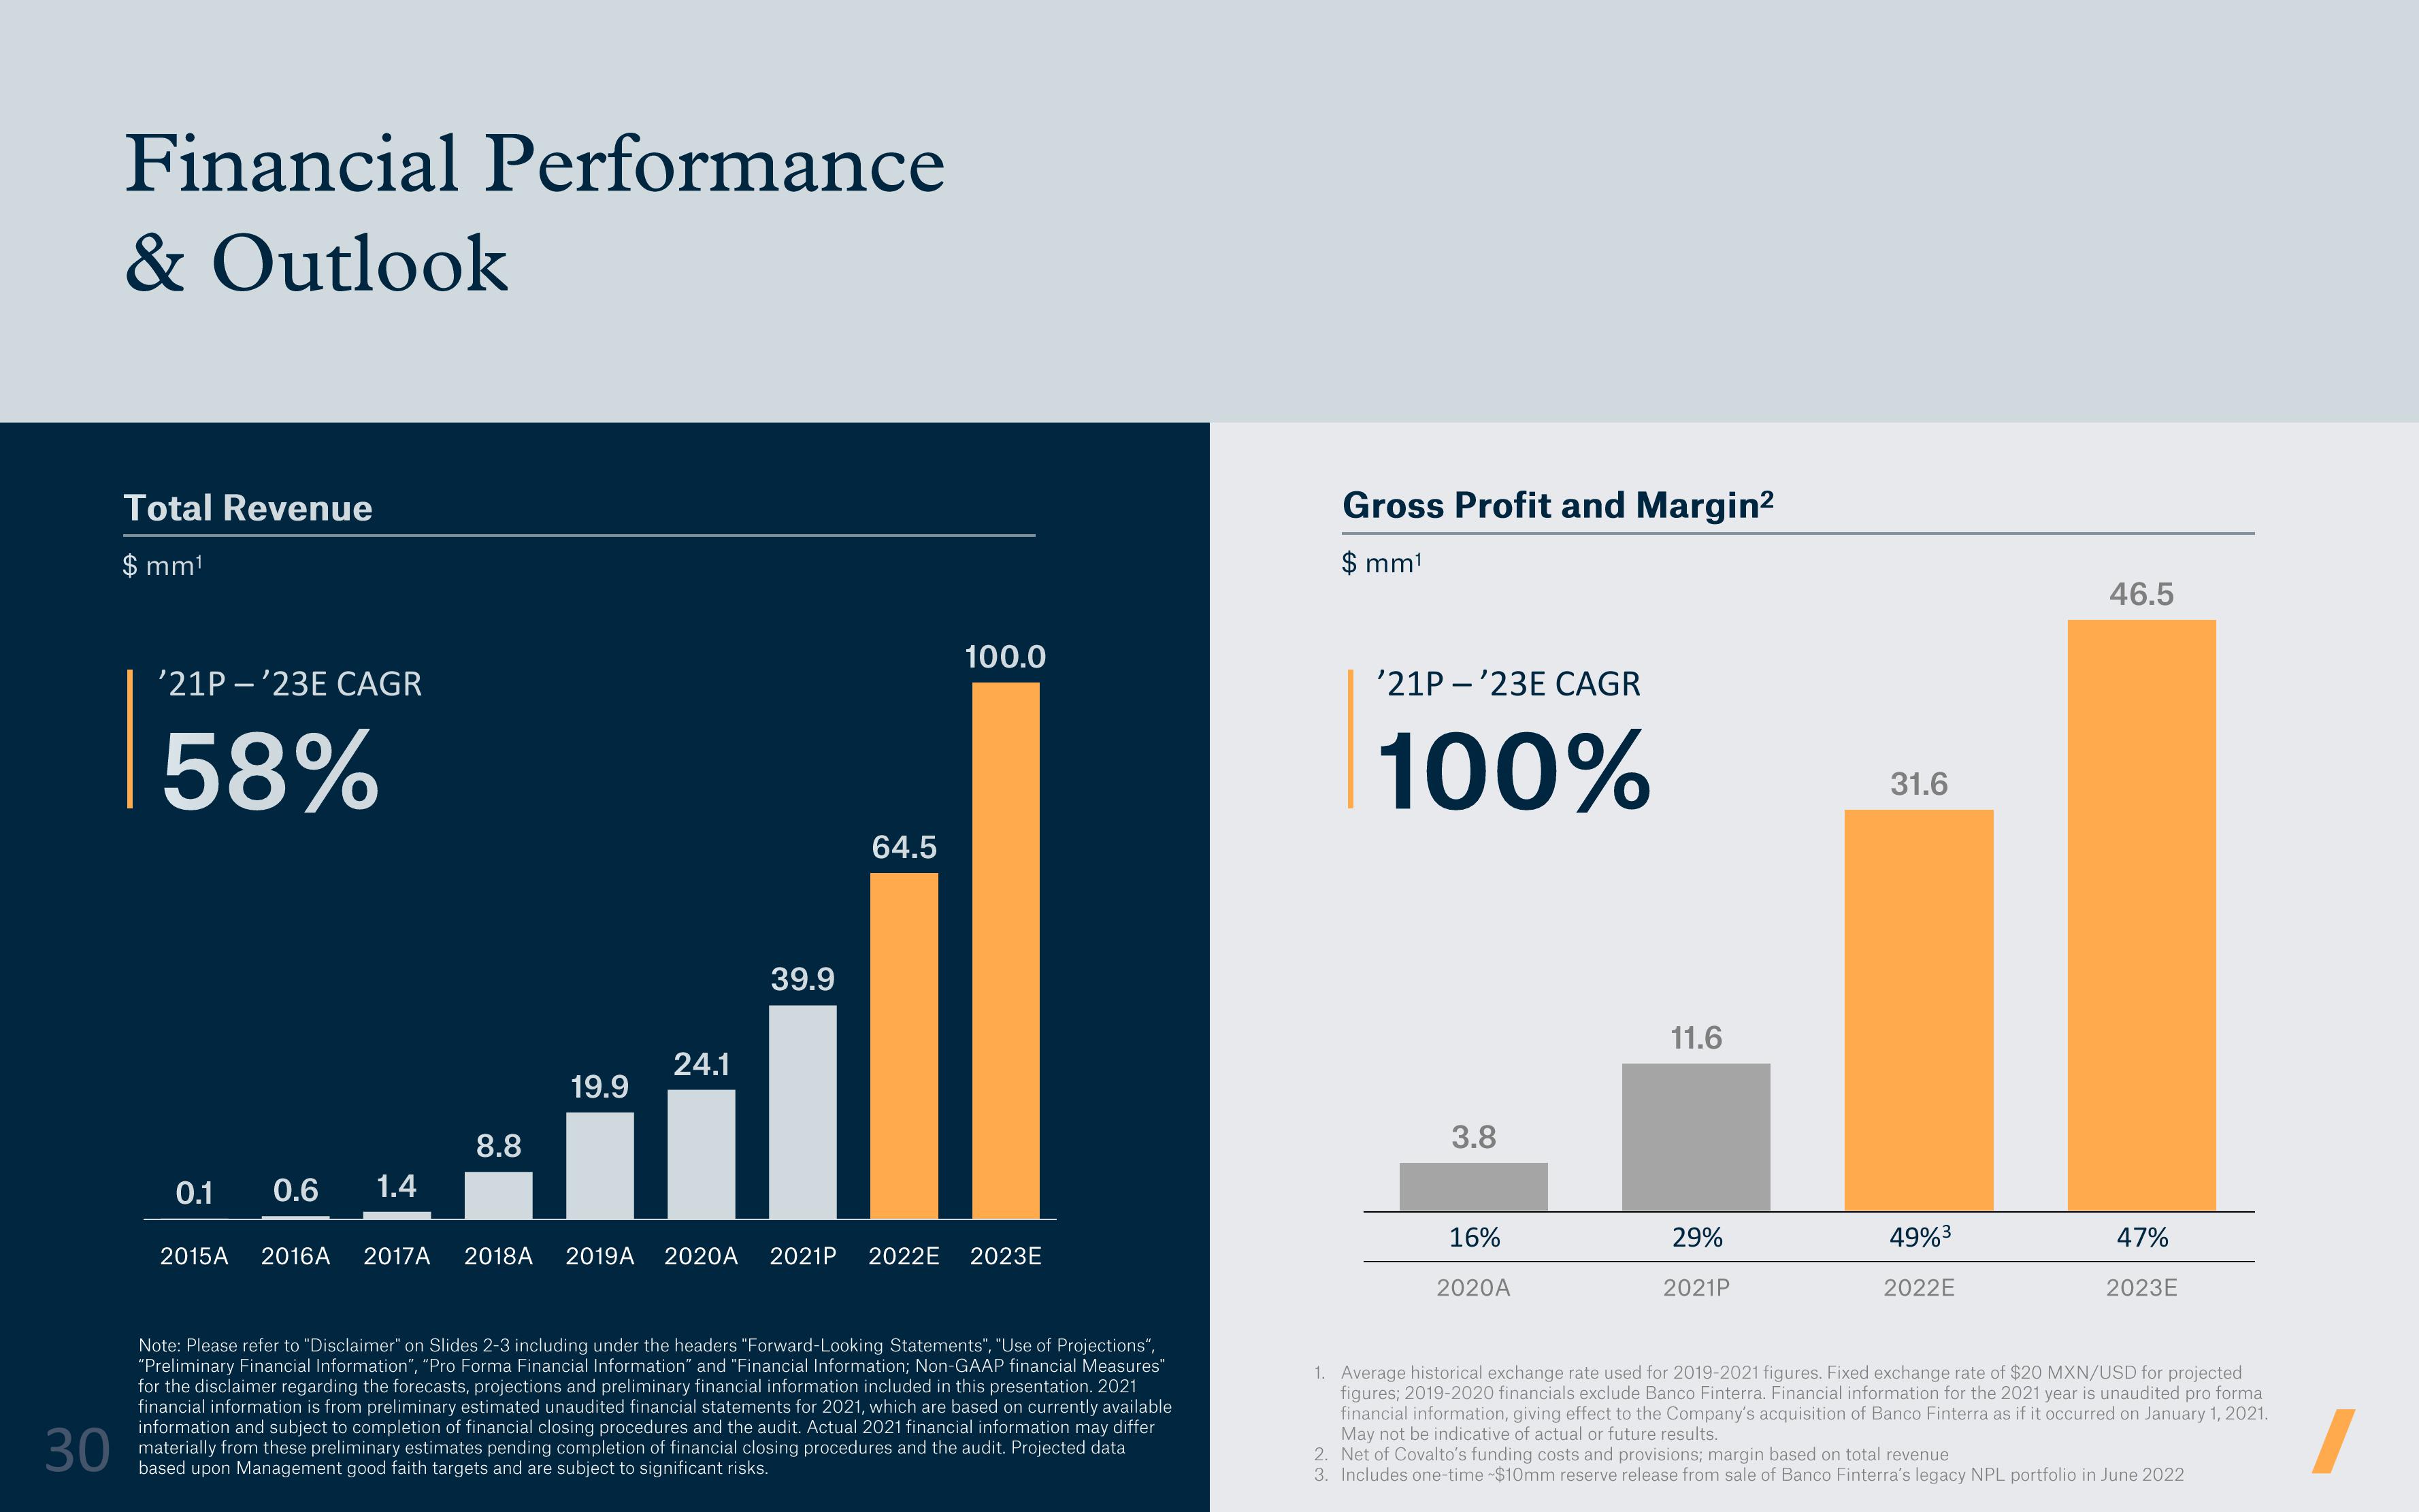
Total Revenue
$ mm¹
'21P -'23E CAGR
58%
0.6
1.4
8.8
19.9
24.1
39.9
64.5
100.0
0.1
2015A 2016A 2017A 2018A 2019A 2020A 2021P 2022E 2023E
Note: Please refer to "Disclaimer" on Slides 2-3 including under the headers "Forward-Looking Statements", "Use of Projections",
"Preliminary Financial Information", "Pro Forma Financial Information" and "Financial Information; Non-GAAP financial Measures"
for the disclaimer regarding the forecasts, projections and preliminary financial information included in this presentation. 2021
financial information is from preliminary estimated unaudited financial statements for 2021, which are based on currently available
information and subject to completion of financial closing procedures and the audit. Actual 2021 financial information may differ
materially from these preliminary estimates pending completion of financial closing procedures and the audit. Projected data
based upon Management good faith targets and are subject to significant risks.
30
Gross Profit and Margin²
$ mm¹
'21P -'23E CAGR
100%
3.8
16%
2020A
11.6
29%
2021P
31.6
49%³
2022E
46.5
47%
2023E
1. Average historical exchange rate used for 2019-2021 figures. Fixed exchange rate of $20 MXN/USD for projected
figures; 2019-2020 financials exclude Banco Finterra. Financial information for the 2021 year is unaudited pro forma
financial information, giving effect to the Company's acquisition of Banco Finterra as if it occurred on January 1, 2021.
May not be indicative of actual or future results.
2. Net of Covalto's funding costs and provisions; margin based on total revenue
3. Includes one-time -$10mm reserve release from sale of Banco Finterra's legacy NPL portfolio in June 2022View entire presentation