Talkspace Results Presentation Deck
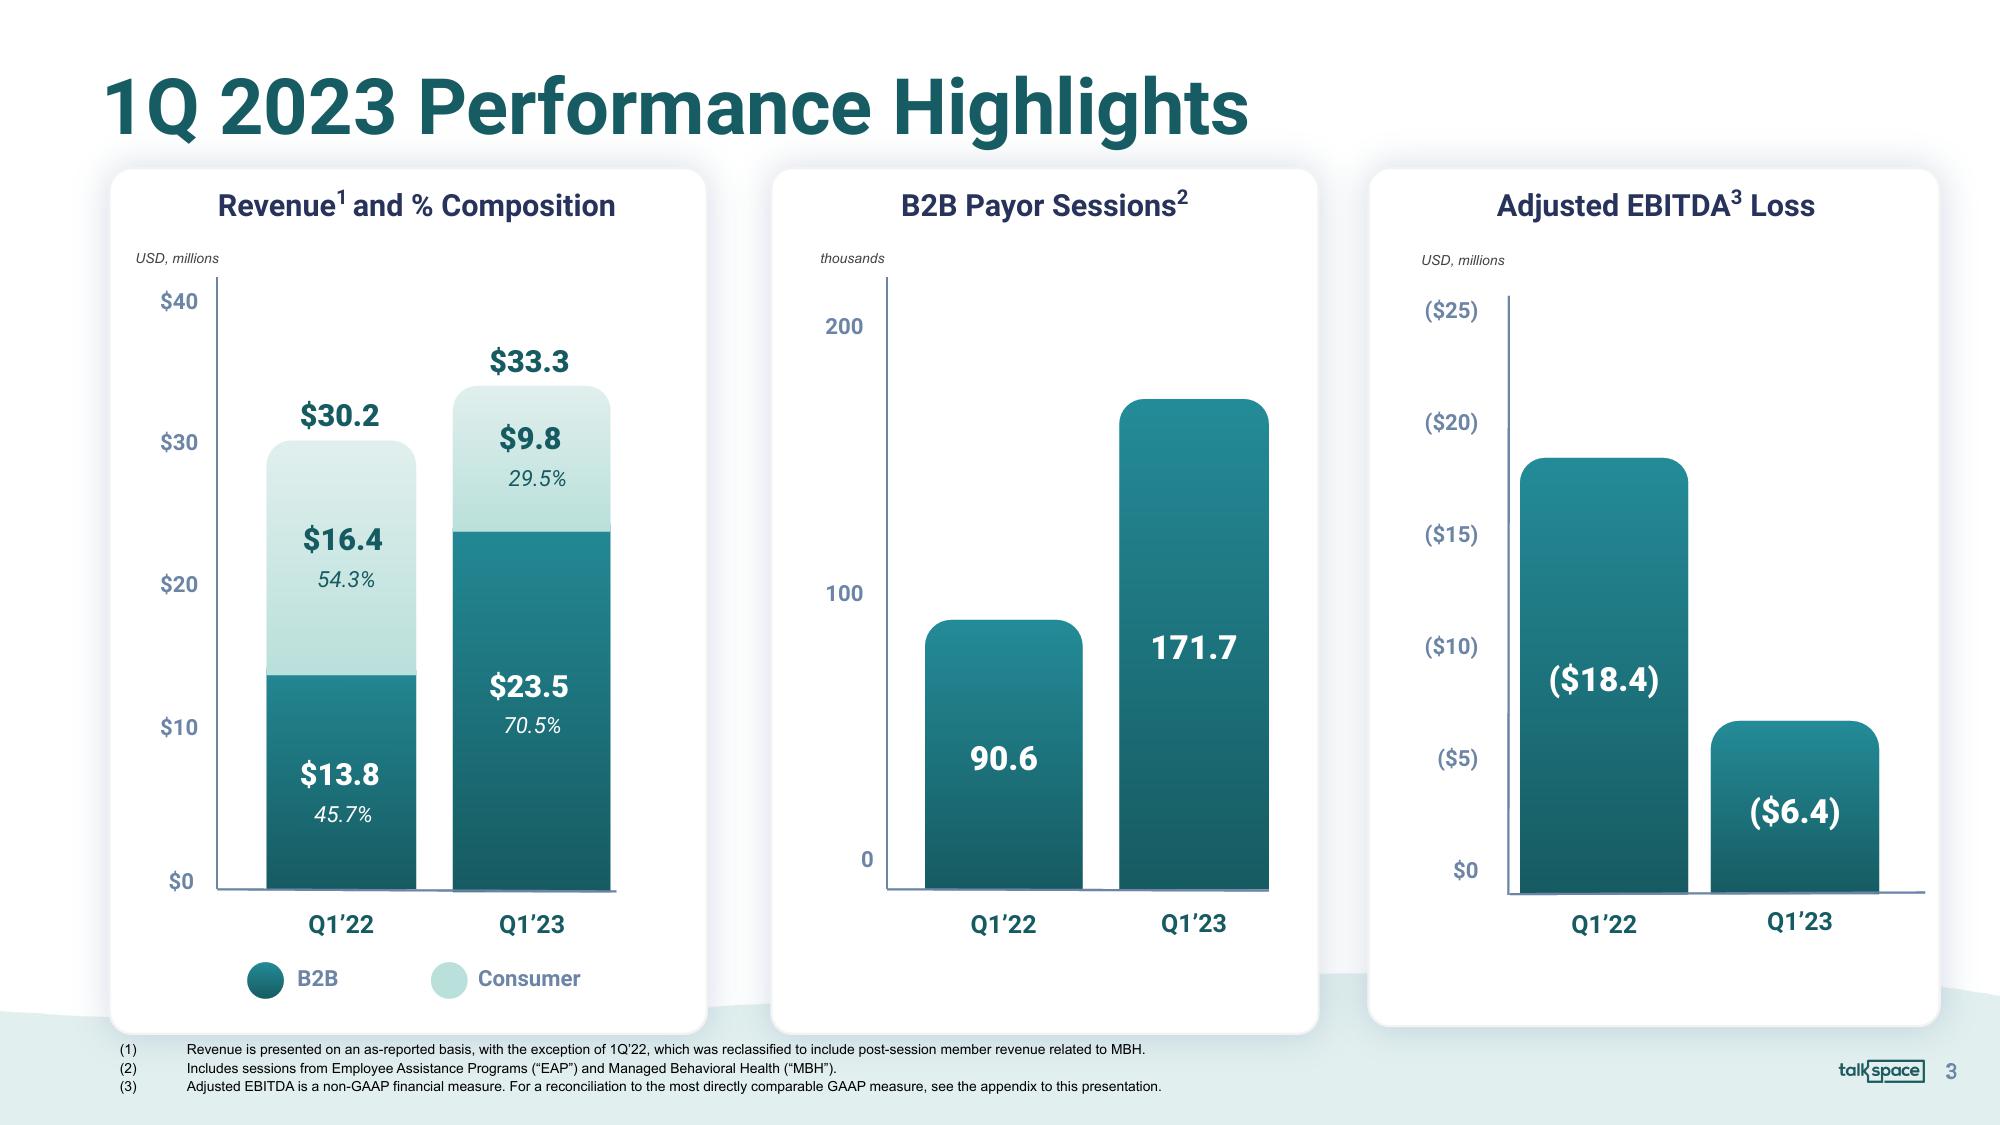
1Q 2023 Performance Highlights
Revenue¹ and % Composition
B2B Payor Sessions²
USD, millions
(1)
(2)
(3)
$40
$30
$20
$10
$0
$30.2
$16.4
54.3%
$13.8
45.7%
Q1'22
B2B
$33.3
$9.8
29.5%
$23.5
70.5%
Q1'23
Consumer
thousands
200
100
0
90.6
Q1'22
171.7
Q1'23
Revenue is presented on an as-reported basis, with the exception of 1Q'22, which was reclassified to include post-session member revenue related to MBH.
Includes sessions from Employee Assistance Programs ("EAP") and Managed Behavioral Health ("MBH").
Adjusted EBITDA is a non-GAAP financial measure. For a reconciliation to the most directly comparable GAAP measure, see the appendix to this presentation.
USD, millions
($25)
($20)
($15)
($10)
($5)
Adjusted EBITDA³ Loss
$0
($18.4)
Q1'22
($6.4)
Q1'23
talk space
3View entire presentation