PJT Partners Investment Banking Pitch Book
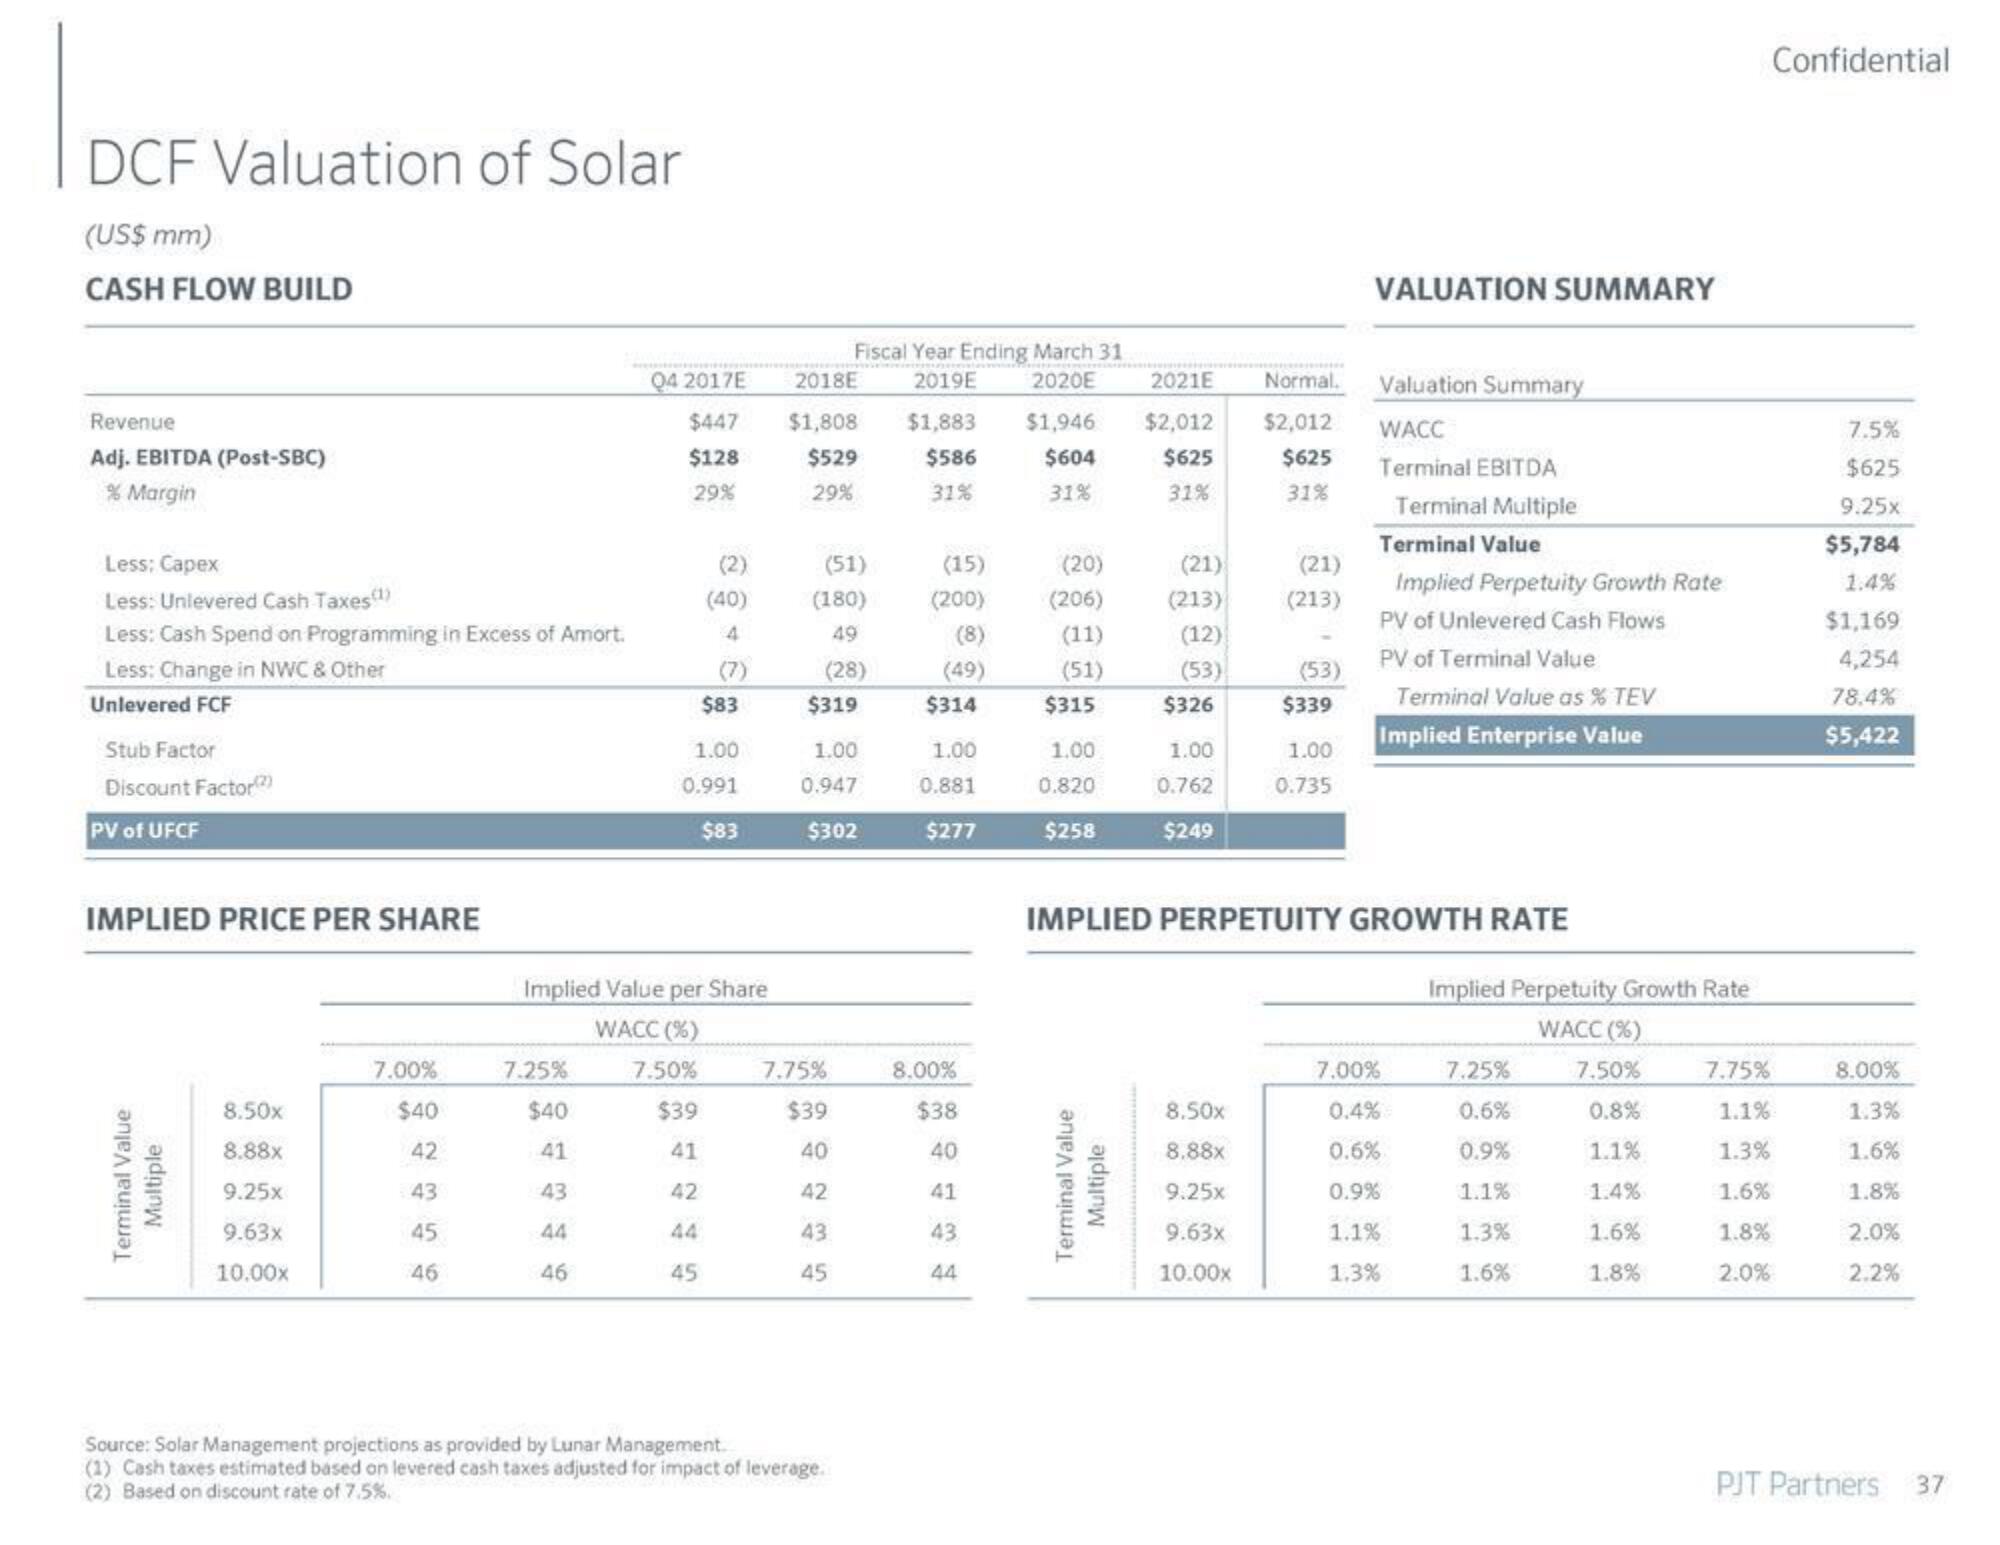
DCF Valuation of Solar
(US$ mm)
CASH FLOW BUILD
Revenue
Adj. EBITDA (Post-SBC)
% Margin
Less: Capex
Less: Unlevered Cash Taxes(¹)
Less: Cash Spend on Programming in Excess of Amort.
Less: Change in NWC & Other
Unlevered FCF
Stub Factor
Discount Factor(2)
PV of UFCF
IMPLIED PRICE PER SHARE
Terminal Value
Multiple
8.50x
8.88x
9.25x
9.63x
10.00x
7.00%
$40
42
43
45
46
04 2017E
$447
$128
29%
7.25%
$40
41
43
44
46
(2)
(40)
4
(7)
45
$83
1.00
0.991
$83
Implied Value per Share
WACC (%)
7.50%
$39
41
42
2018E
$1,808
$529
29%
Fiscal Year Ending March 31
2019E
2020E
$1,883 $1,946
$586
$604
31%
31%
(51)
(180)
49
(28)
$319
1.00
0.947
$302
7.75%
$39
40
42
43
45
Source: Solar Management projections as provided by Lunar Management.
(1) Cash taxes estimated based on levered cash taxes adjusted for impact of leverage.
(2) Based on discount rate of 7.5%.
(15)
(200)
(8)
(49)
$314
1.00
0.881
$277
8.00%
$38
40
41
43
44
(20)
(206)
(11)
(51)
$315
1.00
0.820
$258
2021E
$2,012
$625
31%
Terminal Value
Multiple
(21)
(213)
(12)
(53)
$326
1.00
0.762
$249
Normal.
$2,012
$625
31%
8.50x
8.88x
9.25x
9.63x
10.00x
(21)
(213)
(53)
$339
1.00
0.735
VALUATION SUMMARY
IMPLIED PERPETUITY GROWTH RATE
Valuation Summary
WACC
Terminal EBITDA
Terminal Multiple
Terminal Value
Implied Perpetuity Growth Rate
PV of Unlevered Cash Flows
PV of Terminal Value
Terminal Value as % TEV
Implied Enterprise Value
7.00%
0.4%
0.5%
0.9%
1.1%
1.3%
Implied Perpetuity Growth Rate
WACC (%)
7.50%
0.8%
1.1%
1.4%
1.6%
1.8%
7.25%
0.6%
0.9%
1.1%
1.3%
1.6%
7.75%
1.1%
1.3%
1.6%
1.8%
2.0%
Confidential
7.5%
$625
9.25x
$5,784
1.4%
$1,169
4,254
78.4%
$5,422
8.00%
1.3%
1.6%
1.8%
2.0%
2.2%
PJT Partners
37View entire presentation