First Merchants Investor Presentation Deck
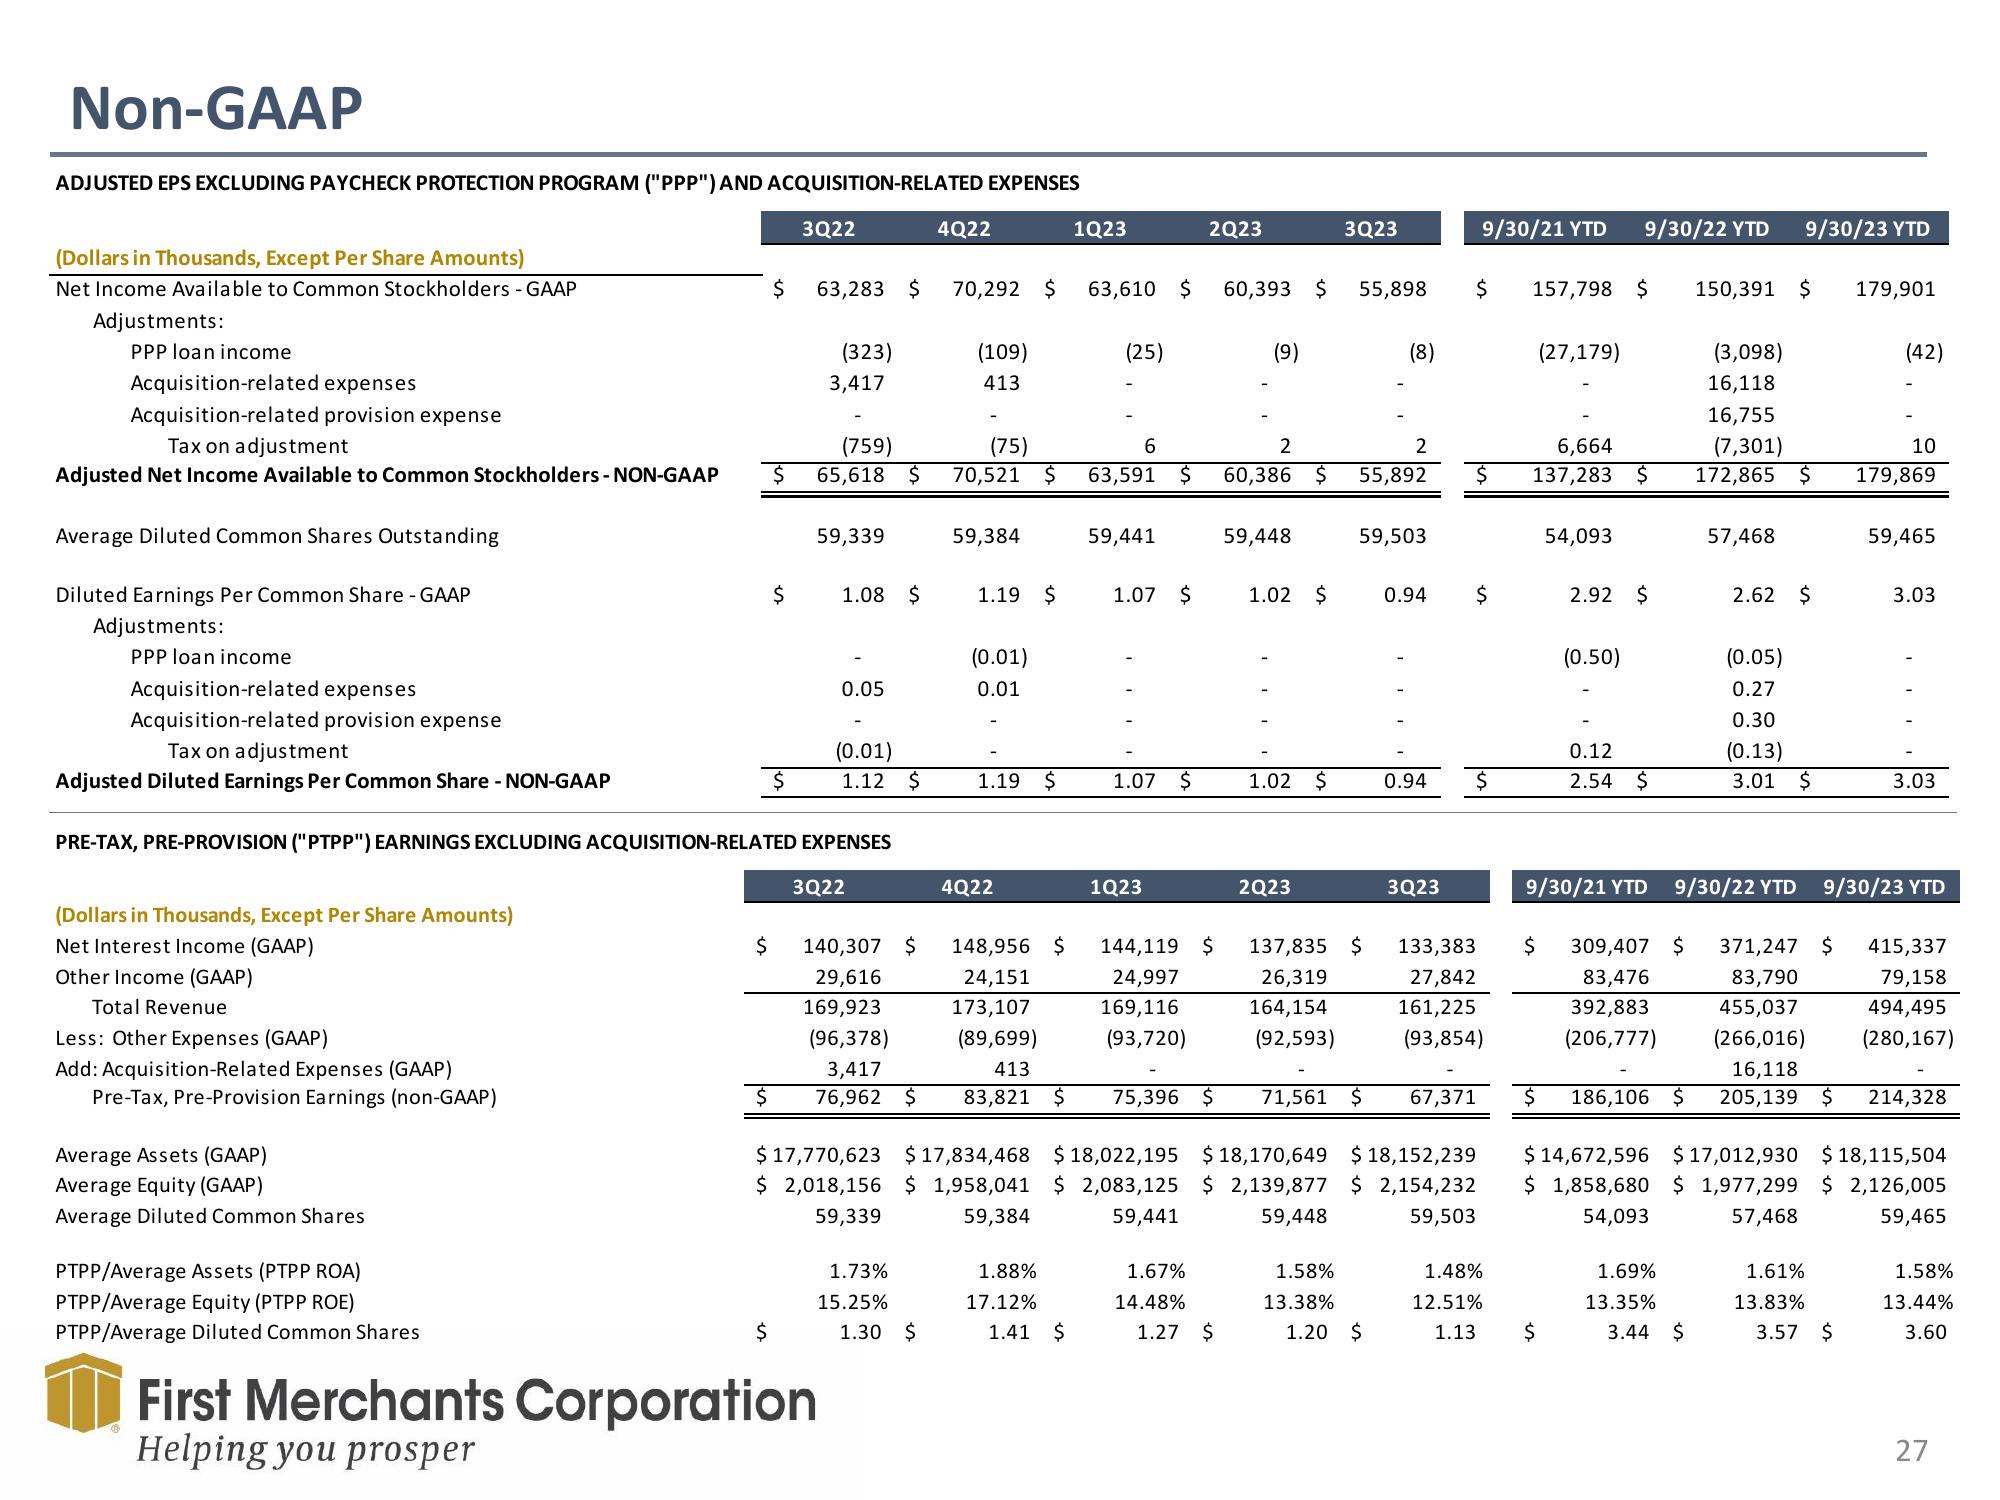
Non-GAAP
ADJUSTED EPS EXCLUDING PAYCHECK PROTECTION PROGRAM ("PPP") AND ACQUISITION-RELATED EXPENSES
(Dollars in Thousands, Except Per Share Amounts)
Net Income Available to Common Stockholders - GAAP
Adjustments:
PPP loan income
Acquisition-related expenses
Acquisition-related provision expense
Tax on adjustment
Adjusted Net Income Available to Common Stockholders - NON-GAAP
Average Diluted Common Shares Outstanding
Diluted Earnings Per Common Share -GAAP
Adjustments:
PPP loan income
Acquisition-related expenses
Acquisition-related provision expense
Tax on adjustment
Adjusted Diluted Earnings Per Common Share - NON-GAAP
(Dollars in Thousands, Except Per Share Amounts)
Net Interest Income (GAAP)
Other Income (GAAP)
Total Revenue
Less: Other Expenses (GAAP)
Add: Acquisition-Related Expenses (GAAP)
Pre-Tax, Pre-Provision Earnings (non-GAAP)
Average Assets (GAAP)
Average Equity (GAAP)
Average Diluted Common Shares
PTPP/Average Assets (PTPP ROA)
PTPP/Average Equity (PTPP ROE)
PTPP/Average Diluted Common Shares
$
$
$
$
$
$
3Q22
(323)
PRE-TAX, PRE-PROVISION ("PTPP") EARNINGS EXCLUDING ACQUISITION-RELATED EXPENSES
3,417
63,283 $ 70,292 $ 63,610 $ 60,393 $
(759)
65,618 $
First Merchants Corporation
Helping you prosper
59,339
1.08 $
0.05
(0.01)
1.12 $
3Q22
4Q22
1.73%
15.25%
(109)
413
1.30 $
(75)
70,521 $
59,384
1.19 $
(0.01)
0.01
1.19
4Q22
$
1Q23
1.88%
17.12%
(25)
1.41 $
6
63,591 $
59,441
1.07 $
1.07 $
1Q23
2Q23
1.67%
14.48%
1.27
(9)
2
60,386 $
140,307 $ 148,956 $ 144,119 $ 137,835 $
29,616
24,151
24,997
26,319
173,107
169,116
164,154
169,923
(96,378)
3,417
(89,699)
(93,720)
(92,593)
413
$ 76,962 $
83,821 $ 75,396 $
$
59,448
1.02 $
3Q23
2Q23
55,898
2
55,892
(8)
59,503
1.02 $ 0.94
$17,770,623 $17,834,468 $18,022,195 $18,170,649 $18,152,239
$ 2,018,156 $ 1,958,041 $ 2,083,125 $ 2,139,877 $ 2,154,232
59,339
59,384
59,441
59,448
59,503
1.58%
13.38%
1.20 $
3Q23
0.94 $
$
9/30/21 YTD
$ 157,798 $ 150,391 $
$
71,561 $ 67,371
133,383
27,842
161,225
(93,854)
1.48%
12.51%
1.13
(27,179)
6,664
137,283
54,093
9/30/22 YTD
$
(0.50)
$
2.92 $
0.12
2.54 $
9/30/21 YTD
(3,098)
16,118
9/30/23 YTD
57,468
1.69%
13.35%
3.44 $
16,755
(7,301)
10
172,865 $ 179,869
2.62 $
9/30/22 YTD
(0.05)
0.27
0.30
(0.13)
3.01 $
179,901
(42)
59,465
1.61%
13.83%
3.57 $
3.03
$ 309,407 $ 371,247 $ 415,337
83,476
83,790
79,158
392,883
455,037
(206,777) (266,016)
16,118
494,495
(280,167)
$ 186,106 $ 205,139 $ 214,328
3.03
9/30/23 YTD
$ 14,672,596 $17,012,930 $ 18,115,504
$ 1,858,680 $ 1,977,299 $ 2,126,005
54,093
57,468
59,465
1.58%
13.44%
3.60
27View entire presentation