Comcast Results Presentation Deck
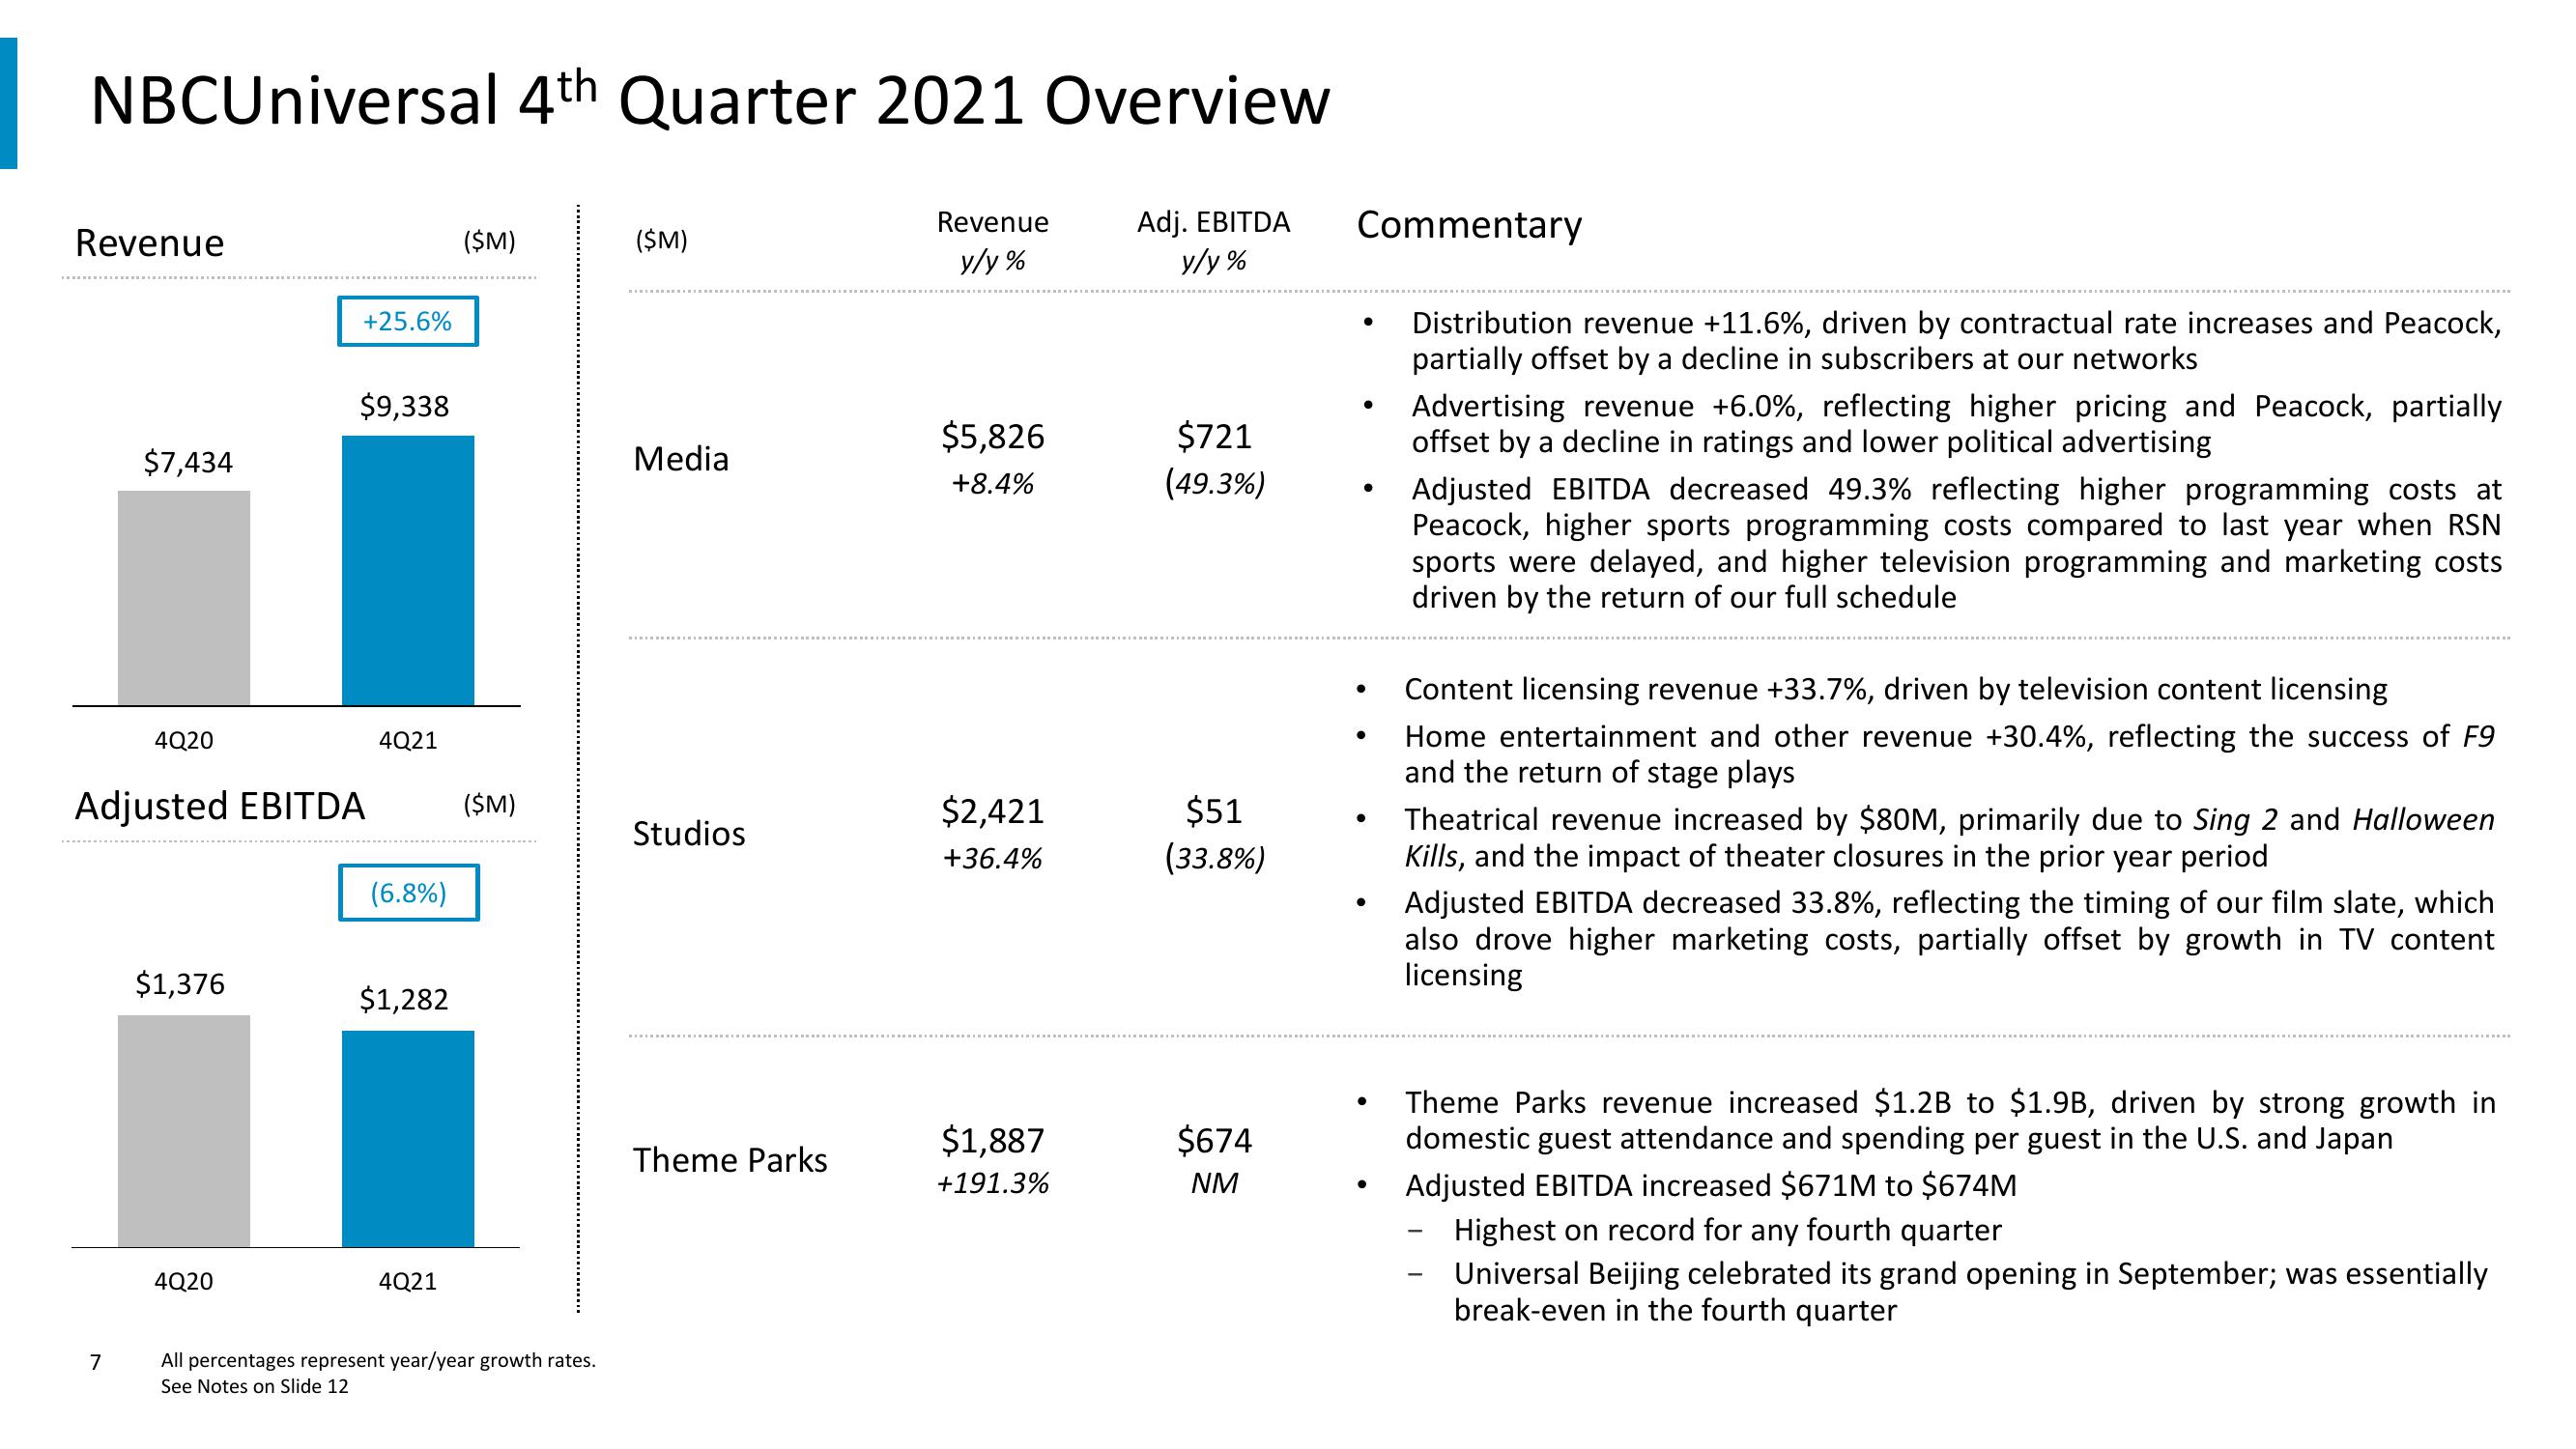
NBCUniversal 4th Quarter 2021 Overview
Revenue
y/y%
Adj. EBITDA
y/y%
Revenue
$7,434
7
4Q20
$1,376
+25.6%
4Q20
$9,338
Adjusted EBITDA ($M)
4Q21
(6.8%)
$1,282
($M)
4Q21
All percentages represent year/year growth rates.
See Notes on Slide 12
($M)
Media
Studios
Theme Parks
$5,826
+8.4%
$2,421
+36.4%
$1,887
+191.3%
$721
(49.3%)
$51
(33.8%)
$674
NM
Commentary
●
●
●
●
●
●
Distribution revenue +11.6%, driven by contractual rate increases and Peacock,
partially offset by a decline in subscribers at our networks
Advertising revenue +6.0%, reflecting higher pricing and Peacock, partially
offset by a decline in ratings and lower political advertising
Adjusted EBITDA decreased 49.3% reflecting higher programming costs at
Peacock, higher sports programming costs compared to last year when RSN
sports were delayed, and higher television programming and marketing costs
driven by the return of our full schedule
Content licensing revenue +33.7%, driven by television content licensing
Home entertainment and other revenue +30.4%, reflecting the success of F9
and the return of stage plays
Theatrical revenue increased by $80M, primarily due to Sing 2 and Halloween
Kills, and the impact of theater closures in the prior year period
Adjusted EBITDA decreased 33.8%, reflecting the timing of our film slate, which
also drove higher marketing costs, partially offset by growth in TV content
licensing
Theme Parks revenue increased $1.2B to $1.9B, driven by strong growth in
domestic guest attendance and spending per guest in the U.S. and Japan
Adjusted EBITDA increased $671M to $674M
Highest on record for any fourth quarter
Universal Beijing celebrated its grand opening in September; was essentially
break-even in the fourth quarter
-View entire presentation