Sisecam Resources Investor Presentation Deck
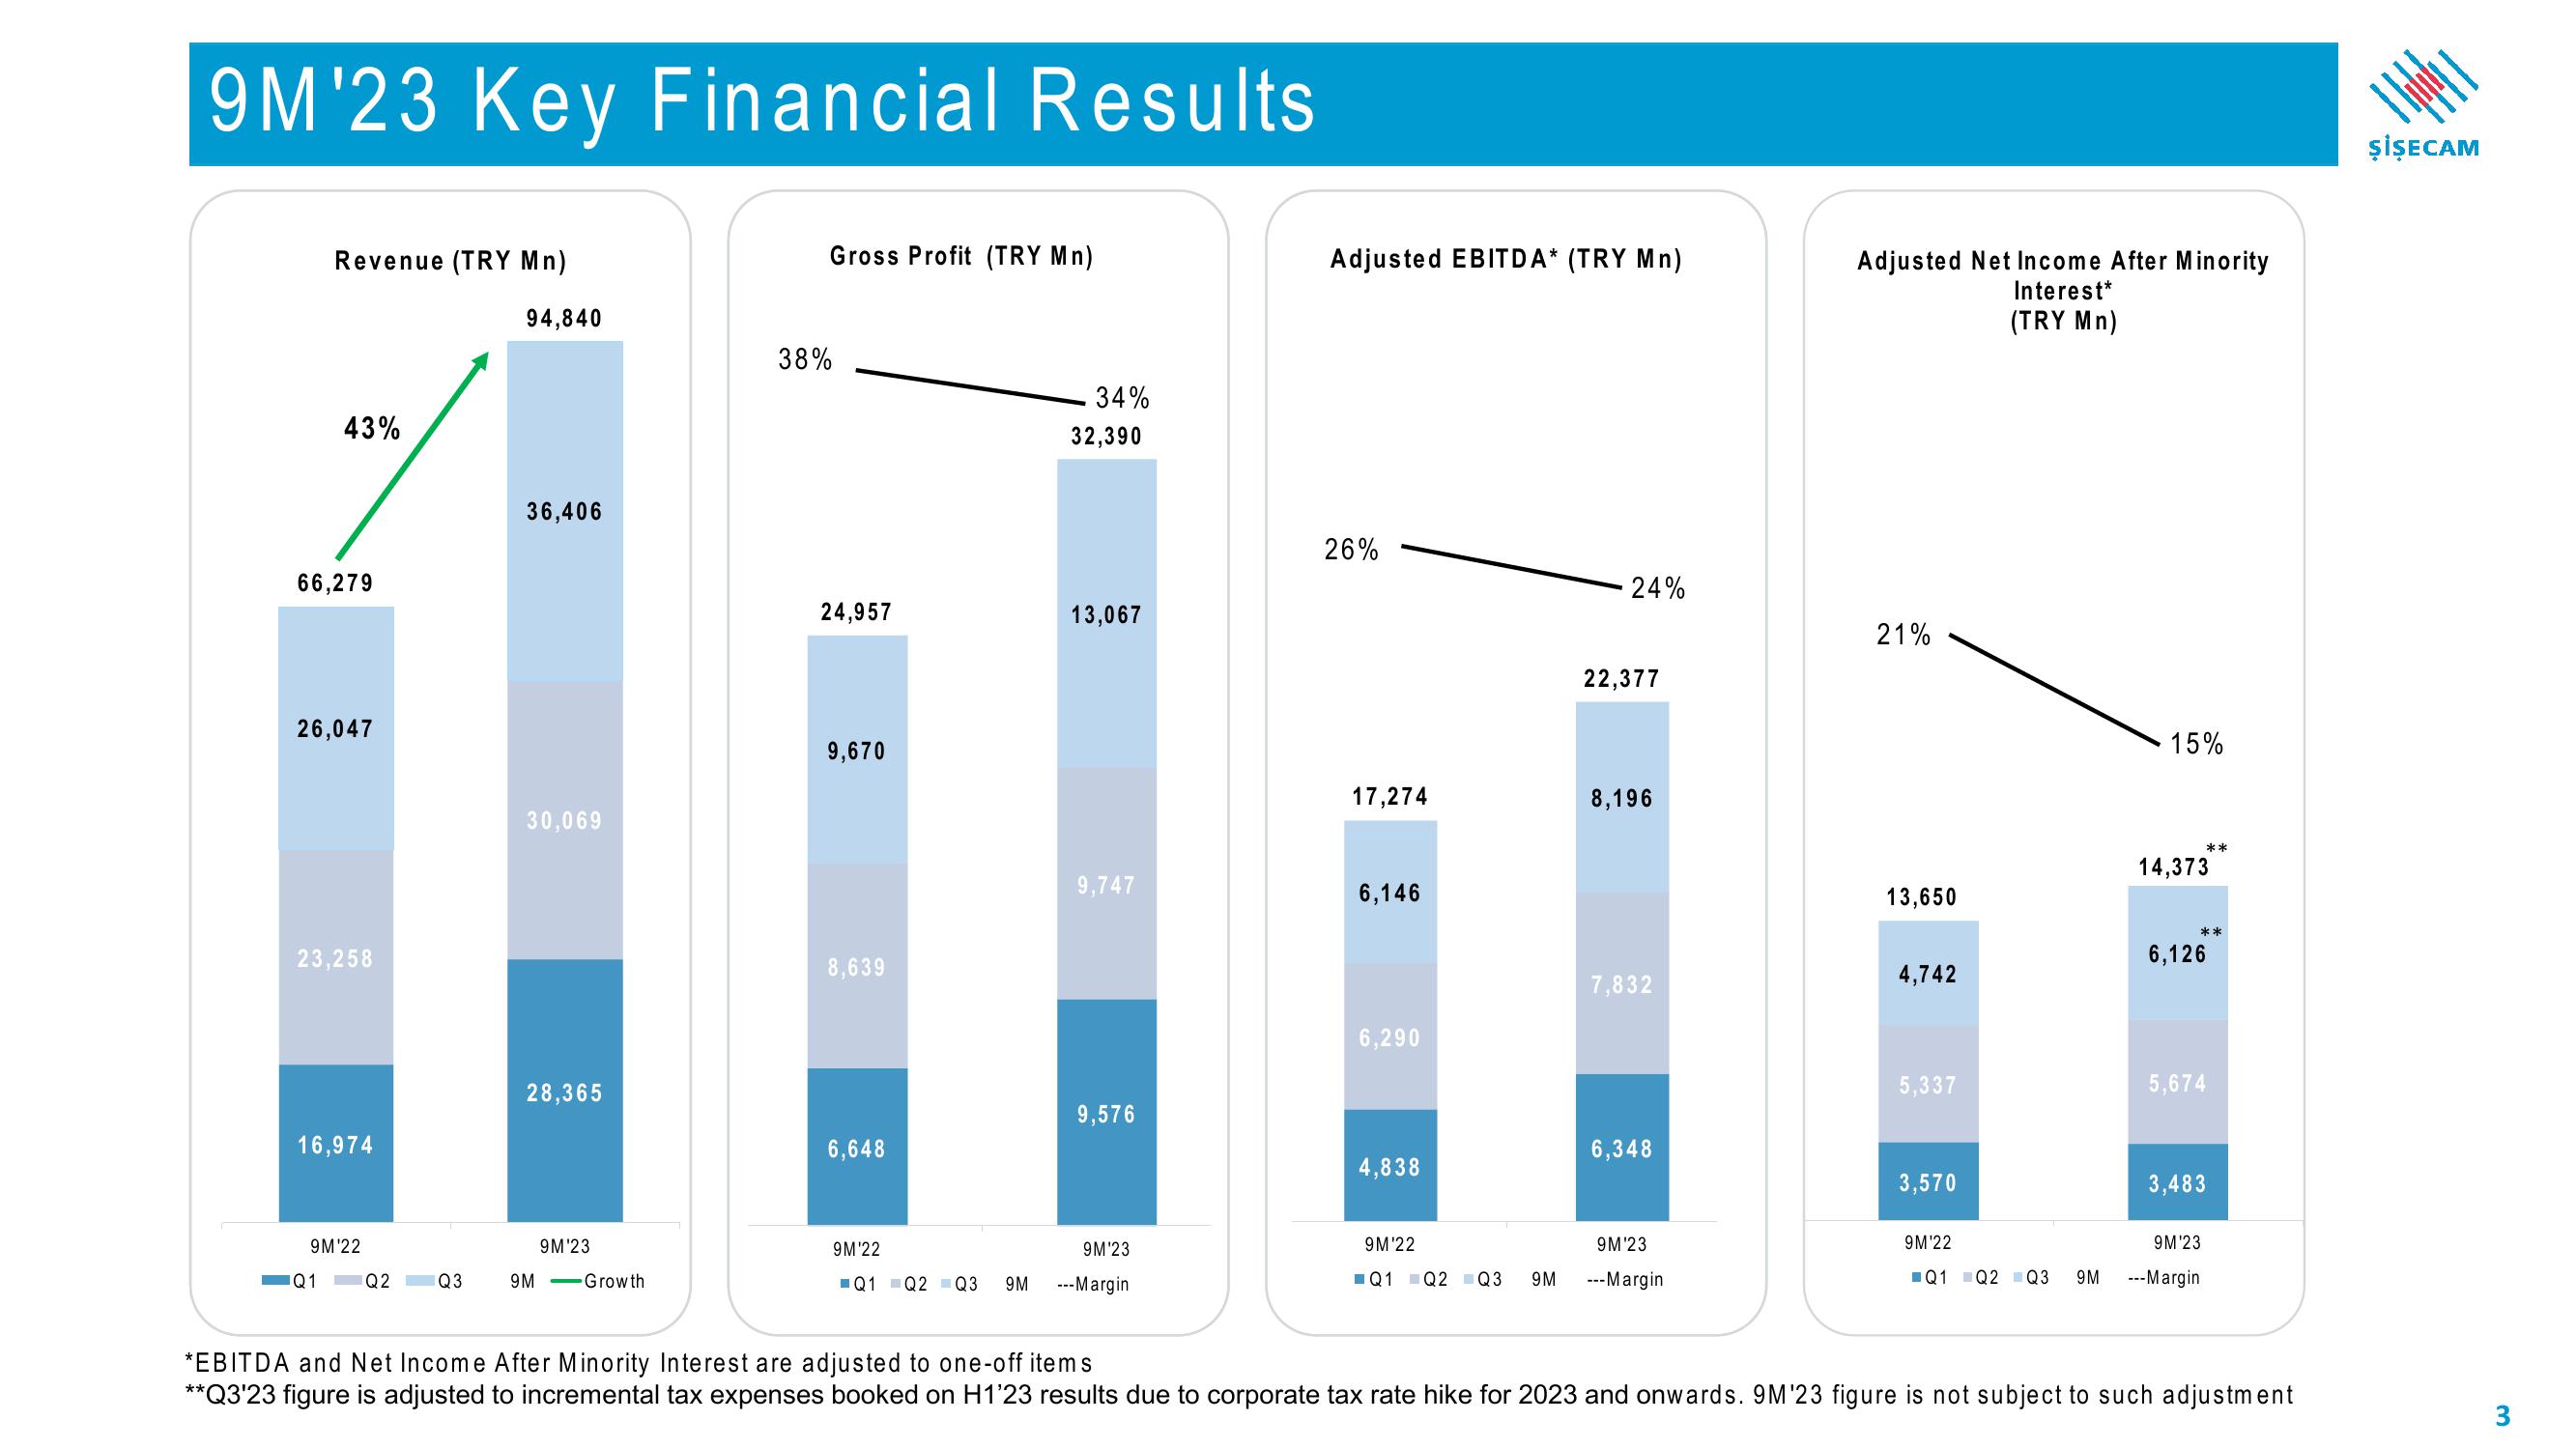
9M¹23 Key Financial Results
Revenue (TRY Mn)
43%
66,279
26,047
23,258
16,974
Q1
9M¹22
Q2
Q3
94,840
36,406
30,069
28,365
9M¹23
9M -Growth
Gross Profit (TRY Mn)
38%
24,957
9,670
8,639
6,648
9M¹22
Q1 Q2 Q3
9M
34%
32,390
13,067
9,747
9,576
9M¹23
---Margin
Adjusted EBITDA* (TRY Mn)
26%
17,274
6,146
6,290
4,838
9M¹22
Q1 Q2 Q3
9M
24%
22,377
8,196
7,832
6,348
9M¹23
---Margin
Adjusted Net Income After Minority
Interest*
(TRY Mn)
21%
13,650
4,742
5,337
3,570
9M¹22
Q1 Q2 Q3
9M
15%
**
14,373
**
6,126
5,674
3,483
9M¹23
---Margin
*EBITDA and Net Income After Minority Interest are adjusted to one-off items
**Q3'23 figure is adjusted to incremental tax expenses booked on H1'23 results due to corporate tax rate hike for 2023 and onwards. 9M¹23 figure is not subject to such adjustment
|||||
ŞİŞECAM
3View entire presentation