Central Pacific Financial Results Presentation Deck slide image

Central Pacific Financial Results Presentation Deck

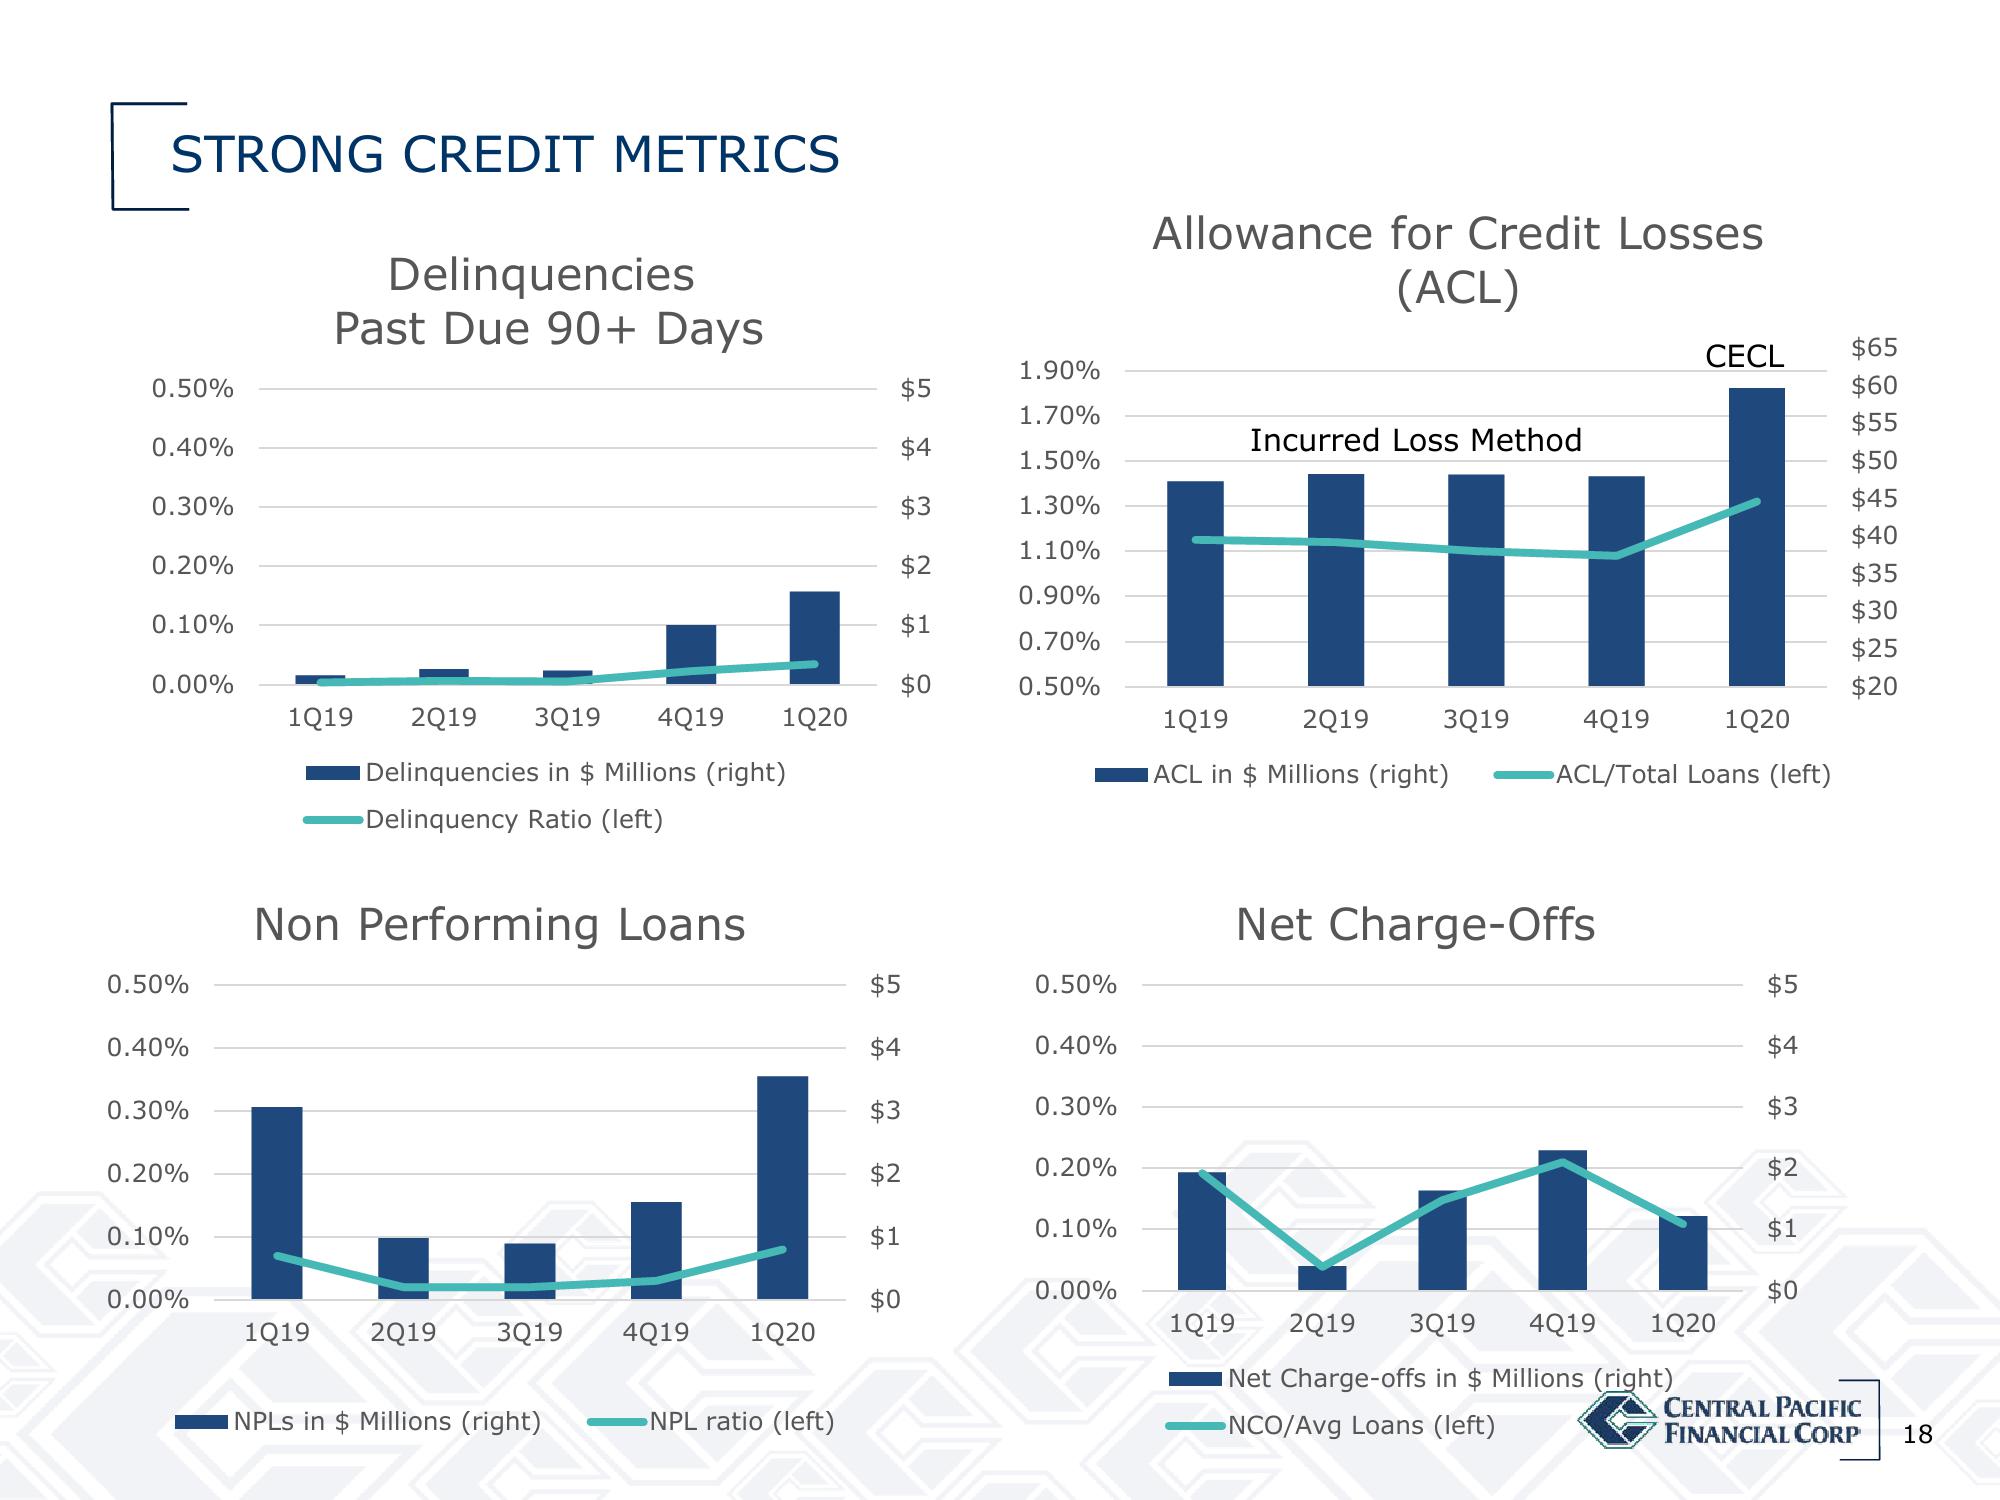
[ STRONG CREDIT METRICS Delinquencies Past Due 90+ Days 0.50% 0.40% 0.30% 0.20% 0.10% 0.00% 0.50% 0.40% 0.30% 0.20% 0.10% 0.00% 1Q19 2019 3Q19 4Q19 1Q20 Delinquencies in $ Millions (right) Delinquency Ratio (left) Non Performing Loans 1Q19 2019 3Q19 INPLS in $ Millions (right) 4Q19 1Q20 NPL ratio (left) $5 $4 $3 $2 $1 $0 $5 $4 $3 $2 $1 $0 1.90% 1.70% 1.50% 1.30% 1.10% 0.90% 0.70% 0.50% 0.50% 0.40% 0.30% 0.20% 0.10% 0.00% Allowance for Credit Losses (ACL) CECL Incurred Loss Method il ||| 1Q19 2Q19 1Q20 4Q19 ACL/Total Loans (left) ACL in $ Millions (right) 3Q19 1Q19 Net Charge-Offs 2Q19 3Q19 4Q19 Net Charge-offs in $ Millions (right) NCO/Avg Loans (left) 1Q20 $5 $4 $3 $2 $1 $0 $65 $60 $55 $50 $45 $40 $35 $30 $25 $20 CENTRAL PACIFIC CORP 18
View entire presentation