Schroders Results Presentation Deck slide image

Schroders Results Presentation Deck

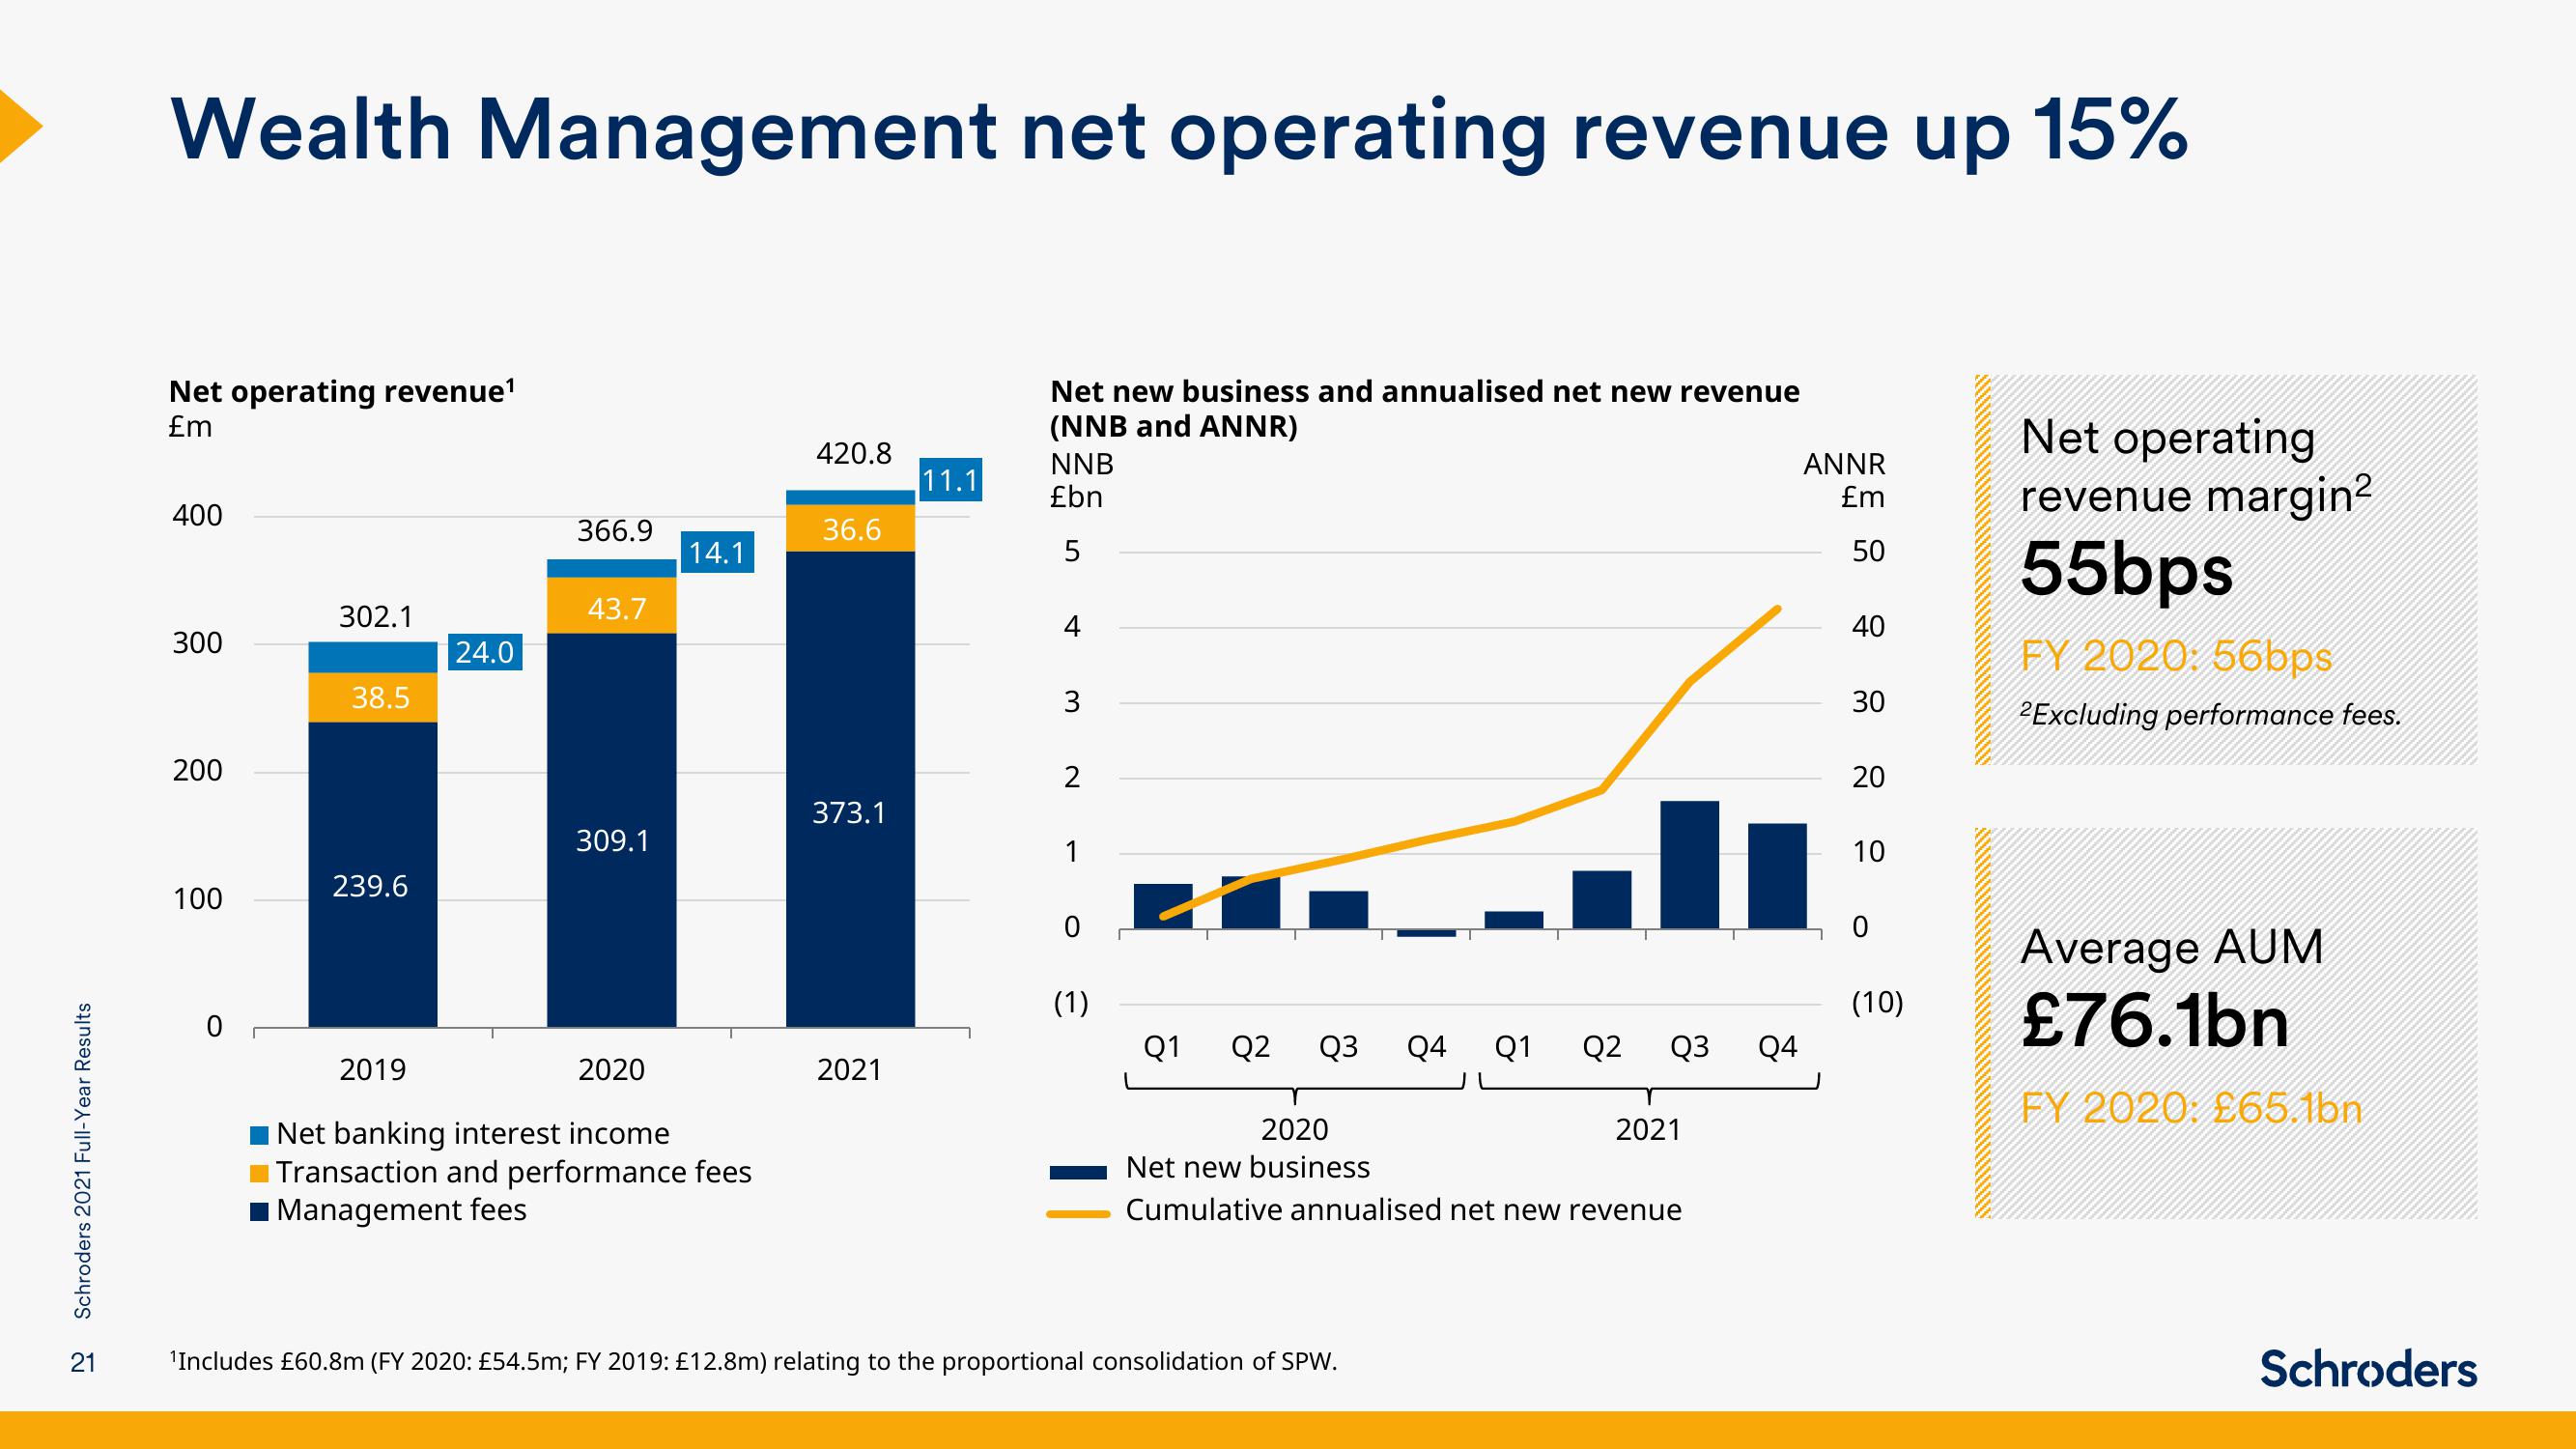
Schroders 2021 Full-Year Results 21 Wealth Management net operating revenue up 15% Net operating revenue¹ £m 400 300 200 100 0 302.1 38.5 239.6 24.0 366.9 43.7 309.1 14.1 2019 2020 Net banking interest income Transaction and performance fees Management fees 420.8 36.6 373.1 2021 11.1 Net new business and annualised net new revenue (NNB and ANNR) NNB £bn 5 4 3 2 1 0 (1) Q1 Q2 Q3 Q4 Q1 Q2 Q3 2020 Net new business Cumulative annualised net new revenue ¹Includes £60.8m (FY 2020: £54.5m; FY 2019: £12.8m) relating to the proportional consolidation of SPW. 2021 Q4 ANNR £m 5⁰0 40 30 20 10 (10) Net operating revenue margin² 55bps FY 2020: 56bps 2Excluding performance fees. Average AUM £76.1bn FY 2020: £65.lbn Schroders
View entire presentation