Freyr SPAC Presentation Deck
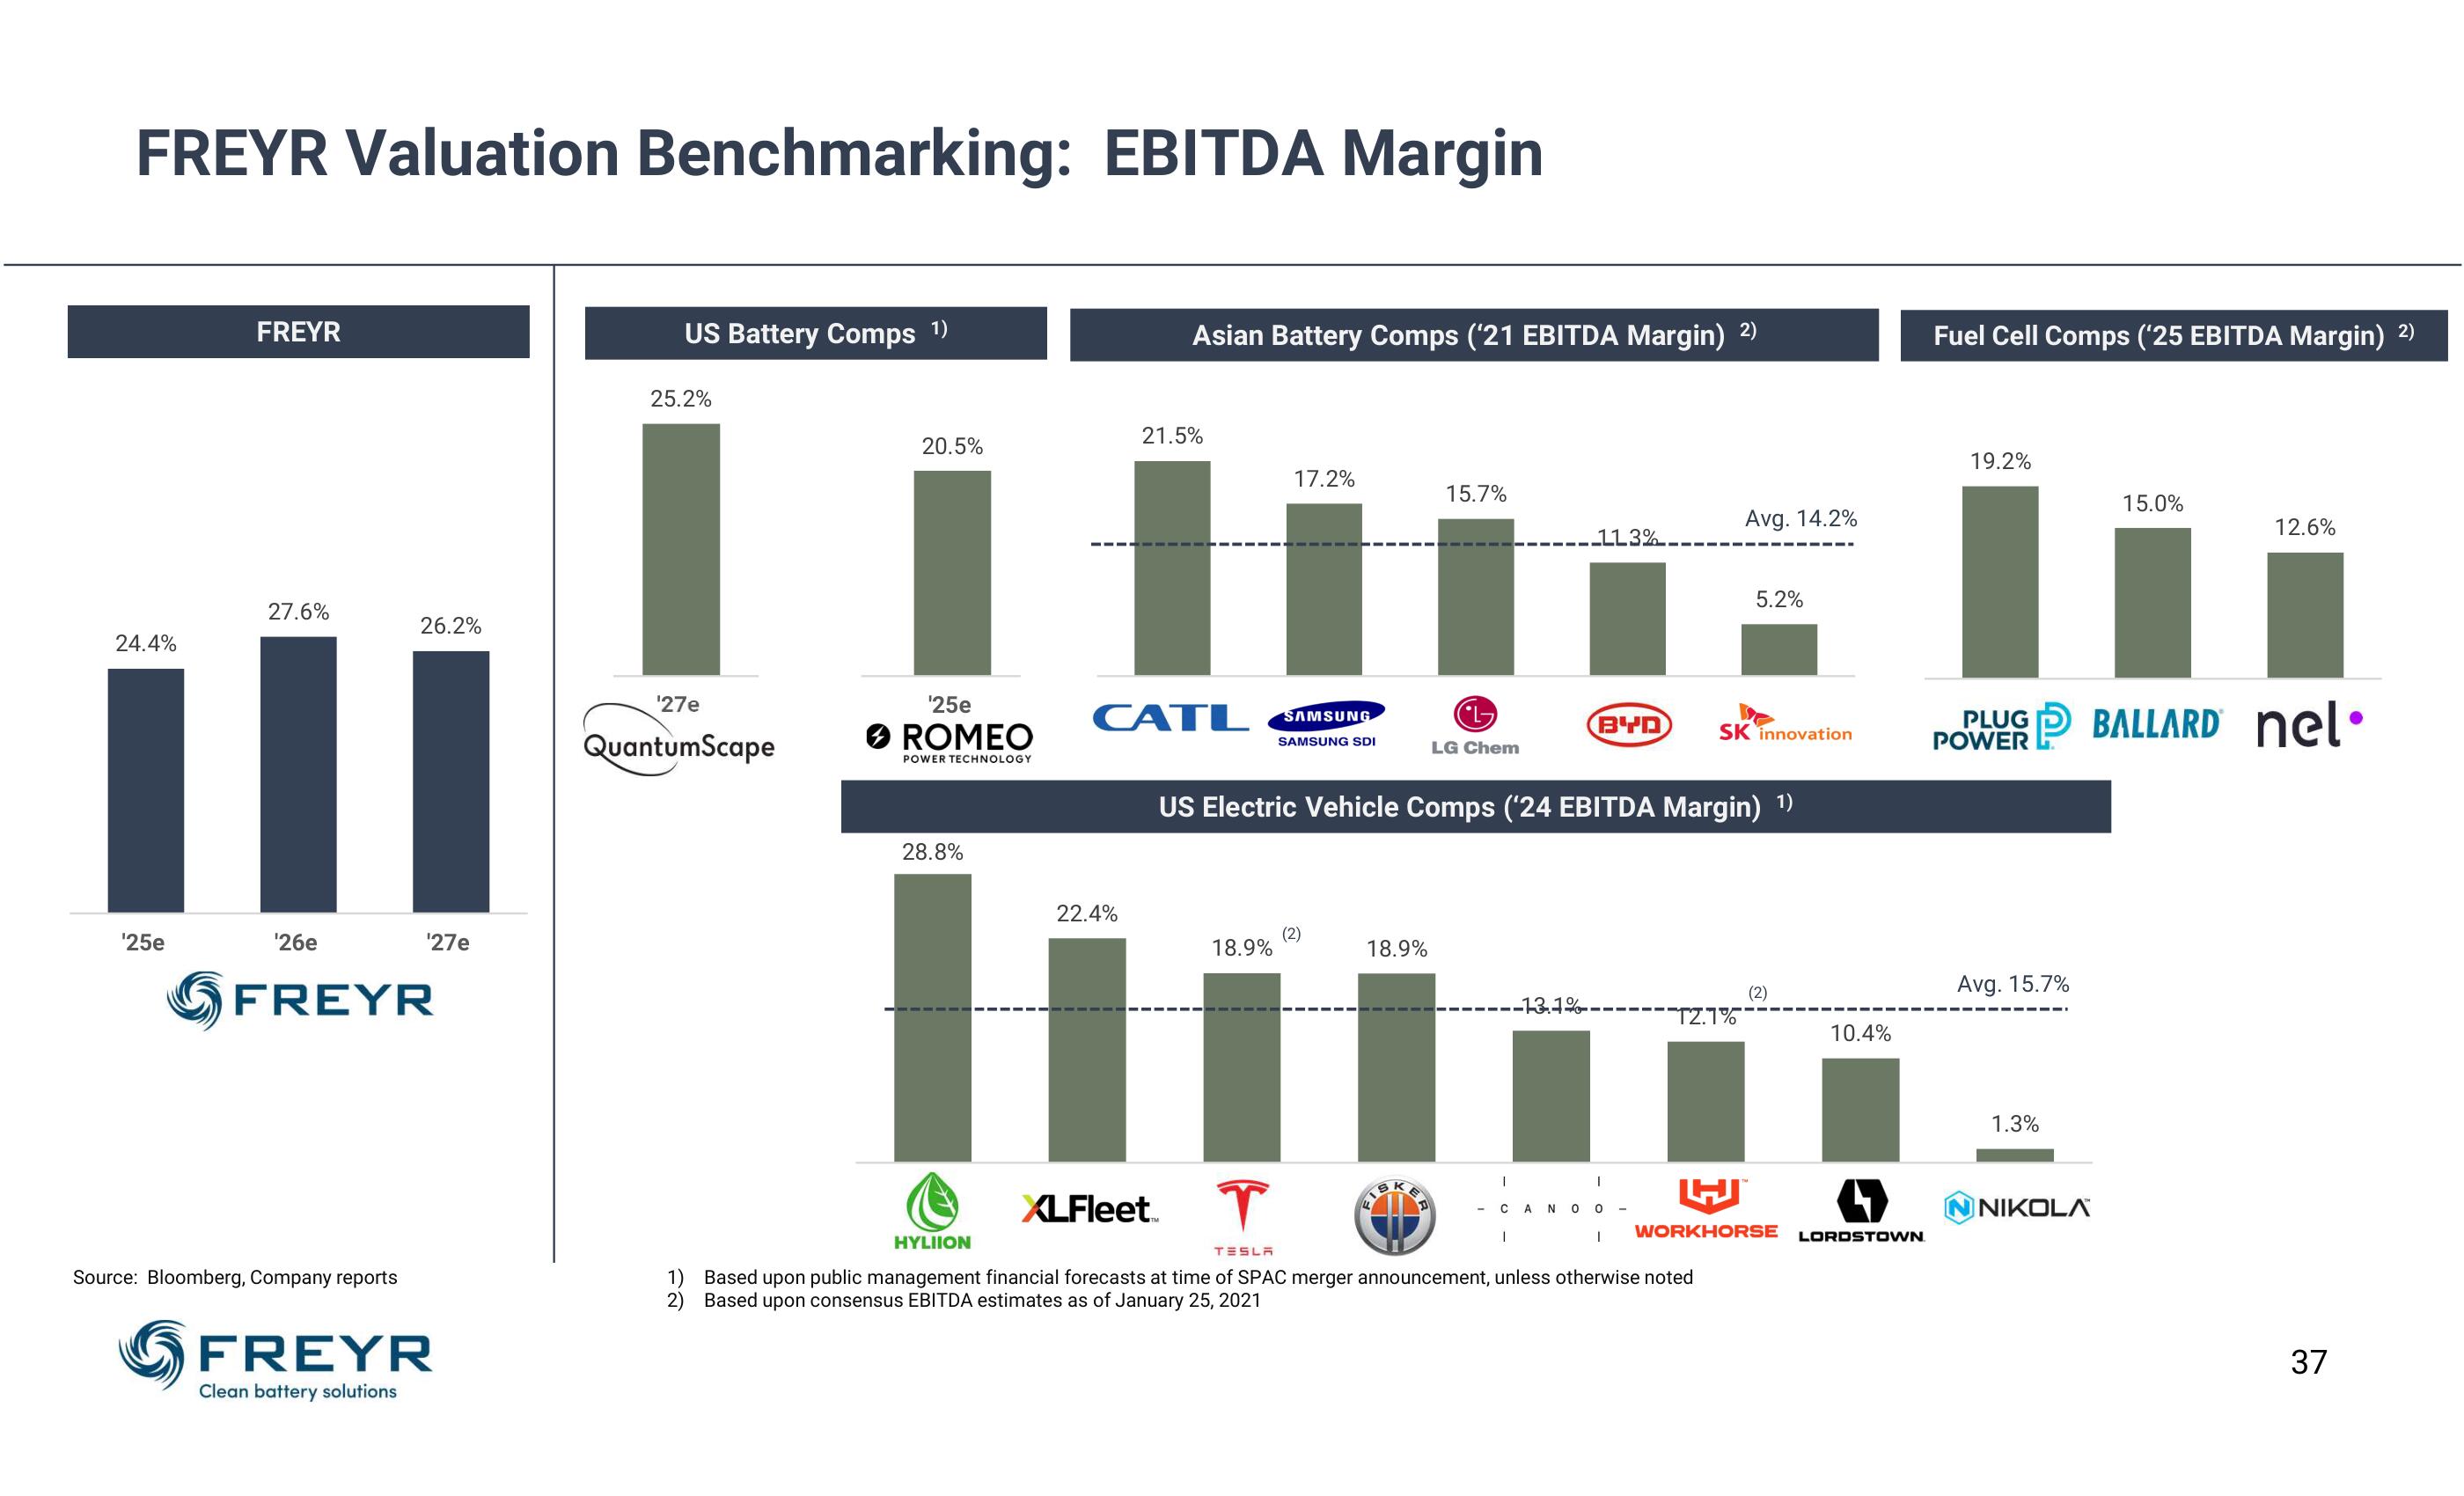
FREYR Valuation Benchmarking: EBITDA Margin
24.4%
¹25e
FREYR
27.6%
¹26e
26.2%
Source: Bloomberg, Company reports
¹27e
FREYR
FREYR
Clean battery solutions
US Battery Comps ¹)
25.2%
'27e
QuantumScape
20.5%
¹25e
ROMEO
POWER TECHNOLOGY
28.8%
Asian Battery Comps (21 EBITDA Margin) 2)
21.5%
+
CATL SAMSUNG
SAMSUNG SDI
22.4%
li
18.9%
17.2%
T
TESLA
(2)
18.9%
Us Electric Vehicle Comps (24 EBITDA Margin) ¹)
15.7%
KE
FIS
(L
LG Chem
1
--113%.
BYD
-13.1%-
I
XLFleet
HYLIION
1) Based upon public management financial forecasts at time of SPAC merger announcement, unless otherwise noted
2) Based upon consensus EBITDA estimates as of January 25, 2021
CANO 0
I
Avg. 14.2%
T2.1%
5.2%
SK innovation
(2)
WORKHORSE
10.4%
LORDSTOWN
Fuel Cell Comps ('25 EBITDA Margin) 2)
19.2%
Avg. 15.7%
PLUG
P
POWER BALLARD nel•
1.3%
15.0%
NIKOLA
12.6%
37View entire presentation