Affirm Results Presentation Deck
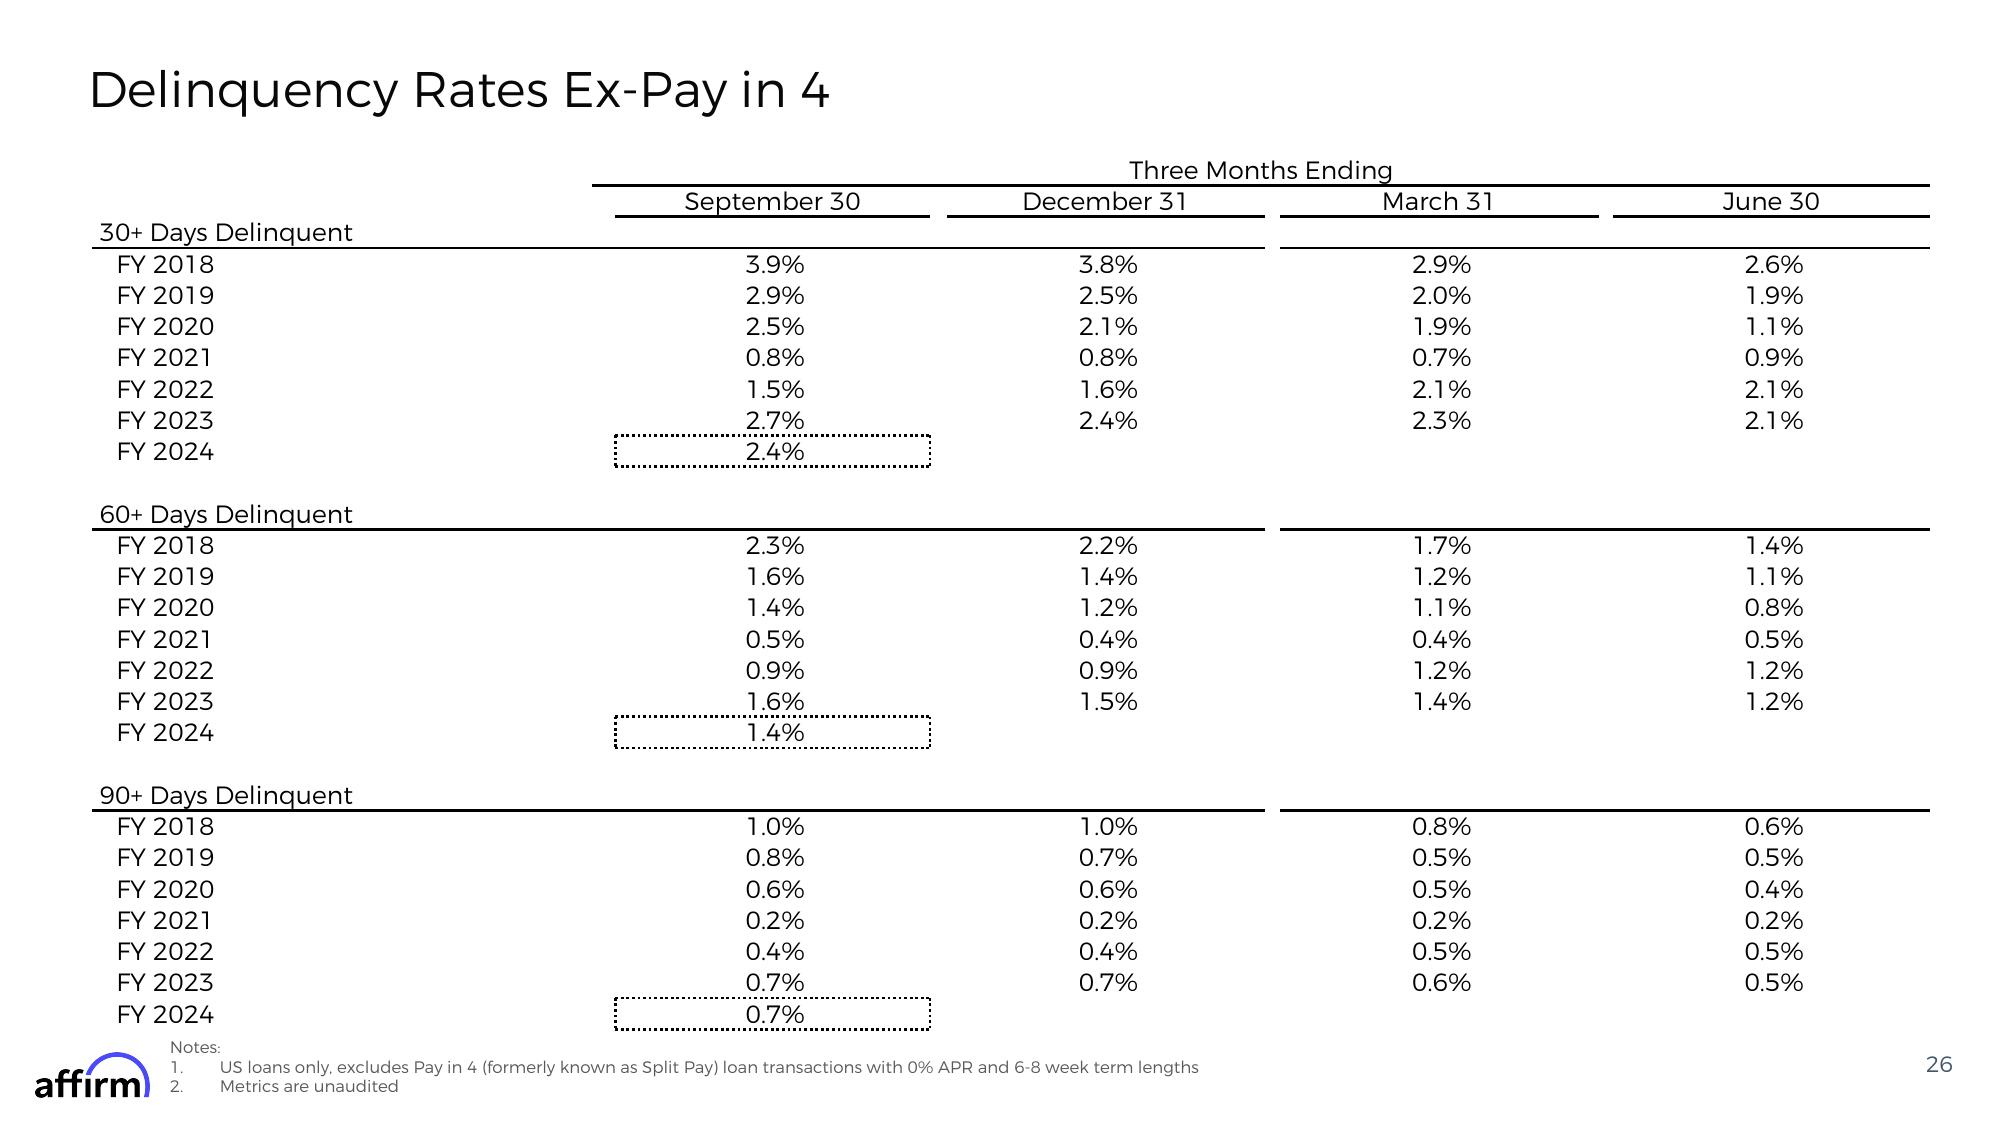
Delinquency Rates Ex-Pay in 4
30+ Days Delinquent
FY 2018
FY 2019
FY 2020
FY 2021
FY 2022
FY 2023
FY 2024
60+ Days Delinquent
FY 2018
FY 2019
FY 2020
FY 2021
FY 2022
FY 2023
FY 2024
90+ Days Delinquent
FY 2018
FY 2019
FY 2020
FY 2021
FY 2022
FY 2023
FY 2024
affirm
September 30
3.9%
2.9%
2.5%
0.8%
1.5%
2.7%
2.4%
2.3%
1.6%
1.4%
0.5%
0.9%
1.6%
1.4%
1.0%
0.8%
0.6%
0.2%
0.4%
0.7%
0.7%
Three Months Ending
December 31
3.8%
2.5%
2.1%
0.8%
1.6%
2.4%
2.2%
1.4%
1.2%
0.4%
0.9%
1.5%
1.0%
0.7%
0.6%
0.2%
0.4%
0.7%
Notes:
1.
US loans only, excludes Pay in 4 (formerly known as Split Pay) loan transactions with 0% APR and 6-8 week term lengths
2. Metrics are unaudited
March 31
2.9%
2.0%
1.9%
0.7%
2.1%
2.3%
1.7%
1.2%
1.1%
0.4%
1.2%
1.4%
0.8%
0.5%
0.5%
0.2%
0.5%
0.6%
June 30
2.6%
1.9%
1.1%
0.9%
2.1%
2.1%
1.4%
1.1%
0.8%
0.5%
1.2%
1.2%
0.6%
0.5%
0.4%
0.2%
0.5%
0.5%
26View entire presentation