Bank of America Investment Banking Pitch Book
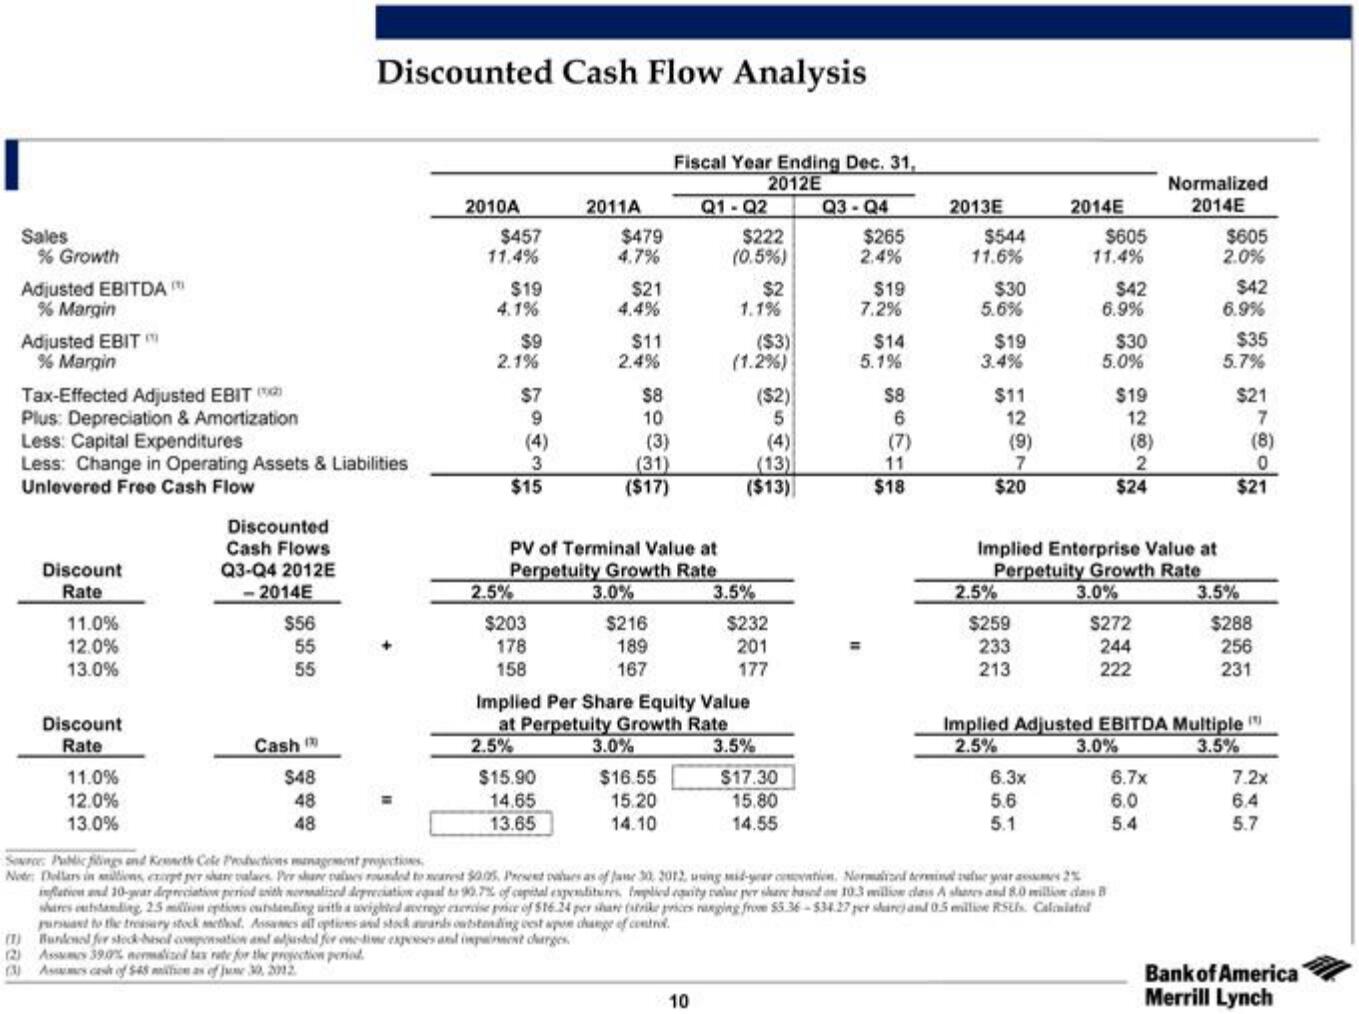
Sales
% Growth
Adjusted EBITDA
% Margin
Adjusted EBIT
% Margin
Tax-Effected Adjusted EBIT (
Plus: Depreciation & Amortization
Less: Capital Expenditures
Less: Change in Operating Assets & Liabilities
Unlevered Free Cash Flow
Discount
Rate
11.0%
12.0%
13.0%
Discount
Rate
11.0%
12.0%
13.0%
Discounted
Cash Flows
Q3-Q4 2012E
2014E
$56
55
55
Cash
$48
48
48
Discounted Cash Flow Analysis
39,0% nermalized tax rate for the projection period.
(3) Asses cash of $45 million as of June 30, 2012
2010A
$457
11.4%
$19
4.1%
2.1%
$9
9
(4)
3
$15
2.5%
$7
$203
178
158
2.5%
2011A
$479
4.7%
$15.90
14.65
13.65
$21
4.4%
$11
2.4%
$8
10
PV of Terminal Value at
Perpetuity Growth Rate
3.0%
(3)
(31)
($17)
Fiscal Year Ending Dec. 31,
2012E
Q3-Q4
$216
189
167
Q1-Q2
$222
(0.5%)
10
1.1%
($3)
(1.2%)
Implied Per Share Equity Value
at Perpetuity Growth Rate
3.0%
$16.55
15.20
14.10
$2
($2)
5
(4)
(13)
($13)
3.5%
$232
201
177
3.5%
$17.30
15.80
14.55
$265
2.4%
$19
7.2%
$14
5.1%
$8
6
(7)
11
$18
2013E
$544
11.6%
$30
5.6%
$19
3.4%
$11
12
(9)
7
$20
2.5%
$259
233
213
2014E
$605
11.4%
6.3x
5.6
5.1
$42
6.9%
Source: Public filings and Kenneth Cole Productions management projections
Note: Dollars in millions, exopt per share values. Per share values rounded to nearest $0.05 Presest palues as of June 30, 2012, uning mid-year contion. Normalized terminal aur year am 2%
inflation and 10-year depreciation period with normalized depreciation equal to 90.7% of capital expenditures, fplied equity value per share based on 10.3 million class A shares and 8.0 million das B
shares outstanding, 25 million options outstanding with a weighted average exercise price of $16.24 per share (strike prices ranging from $5.36-534.27 per share) and 0.5 million RSLs. Calmisted
pursuant to the treasury stock method, Assames all optices and stock awards outstanding est apue change of control.
(1) Bundened for stock-hasol compensation and adjusted for one-dime expenses and impairment charges.
(2) Ass
$30
5.0%
Implied Enterprise Value at
Perpetuity Growth Rate
3.0%
$19
12
(8)
2
$24
$272
244
222
Normalized
2014E
6.7x
6.0
5.4
$605
2.0%
$42
6.9%
$35
5.7%
$21
7
(8)
$21
Implied Adjusted EBITDA Multiple
2.5%
3.0%
3.5%
3.5%
$288
256
231
7.2x
6.4
5.7
Bank of America
Merrill LynchView entire presentation