HSBC Results Presentation Deck
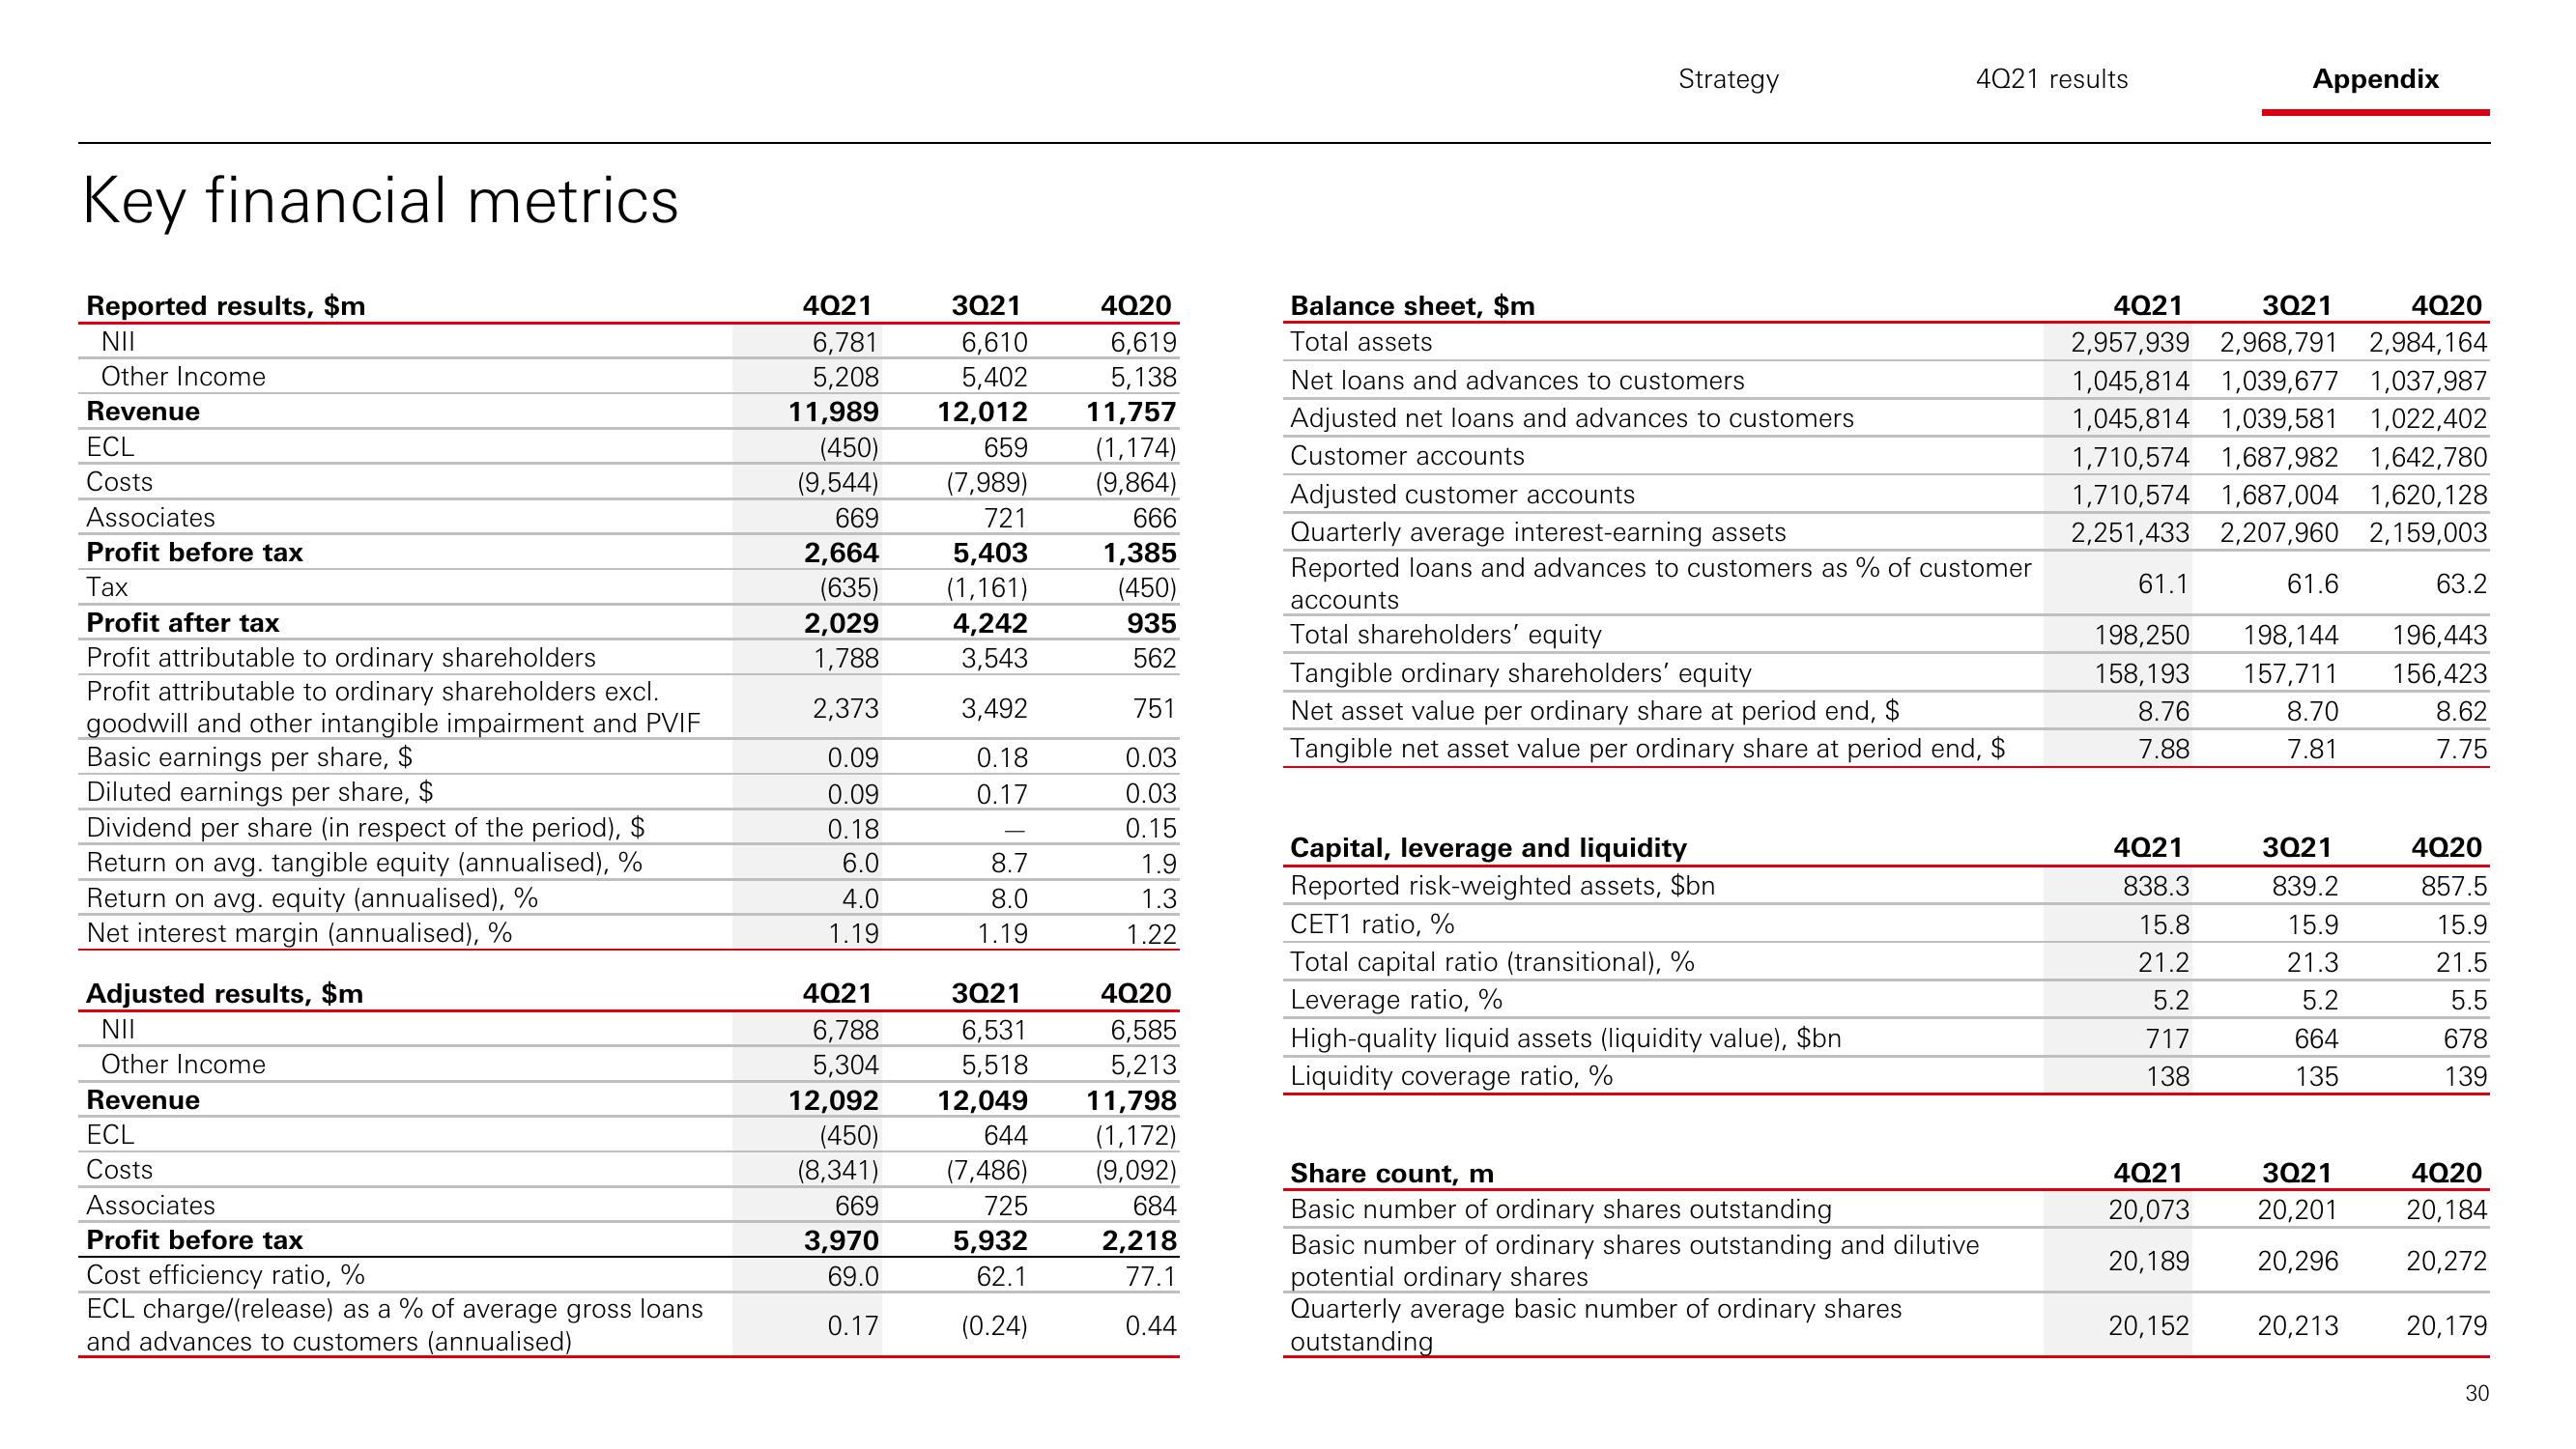
Key financial metrics
Reported results, $m
NII
Other Income
Revenue
ECL
Costs
Associates
Profit before tax
Tax
Profit after tax
Profit attributable to ordinary shareholders
Profit attributable to ordinary shareholders excl.
goodwill and other intangible impairment and PVIF
Basic earnings per share, $
Diluted earnings per share, $
Dividend per share (in respect of the period), $
Return on avg. tangible equity (annualised), %
Return on avg. equity (annualised), %
Net interest margin (annualised), %
Adjusted results, $m
NII
Other Income
Revenue
ECL
Costs
Associates
Profit before tax
Cost efficiency ratio, %
ECL charge/(release) as a % of average gross loans
and advances to customers (annualised)
4Q21
6,781
5,208
11,989
(450)
(9,544)
669
2,664
(635)
2,029
1,788
2,373
0.09
0.09
0.18
6.0
4.0
1.19
4Q21
3Q21
4Q20
6,610
6,619
5,138
5,402
12,012 11,757
659 (1,174)
(7,989) (9,864)
721
5,403
(1,161)
666
1,385
(450)
935
562
4,242
3,543
3,492
751
0.18
0.03
0.17
0.03
0.15
8.7
8.0
1.19
3Q21
6,788
6,531
5,304
5,518
12,092 12,049
(450)
(8,341)
644
(7,486)
725
5,932
669
3,970
69.0
62.1
0.17
(0.24)
1.9
1.3
1.22
4Q20
6,585
5,213
11,798
(1,172)
(9,092)
684
2,218
77.1
0.44
Strategy
Balance sheet, $m
Total assets
Net loans and advances to customers
Adjusted net loans and advances to customers
Customer accounts
Adjusted customer accounts
Quarterly average interest-earning assets
Reported loans and advances to customers as % of customer
accounts
Total shareholders' equity
Tangible ordinary shareholders' equity
Net asset value per ordinary share at period end, $
Tangible net asset value per ordinary share at period end, $
Capital, leverage and liquidity
Reported risk-weighted assets, $bn
4021 results
CET1 ratio, %
Total capital ratio (transitional), %
Leverage ratio, %
High-quality liquid assets (liquidity value), $bn
Liquidity coverage ratio, %
Share count, m
Basic number of ordinary shares outstanding
Basic number of ordinary shares outstanding and dilutive
potential ordinary shares
Quarterly average basic number of ordinary shares
outstanding
4Q20
4Q21
3Q21
2,957,939 2,968,791 2,984,164
1,045,814 1,039,677 1,037,987
1,045,814 1,039,581 1,022,402
1,710,574 1,687,982 1,642,780
1,710,574 1,687,004 1,620,128
2,251,433 2,207,960 2,159,003
61.1
198,250
158,193
8.76
7.88
4Q21
838.3
15.8
21.2
5.2
717
138
4021
20,073
20,189
Appendix
20,152
61.6
198,144
157,711
8.70
7.81
3Q21
839.2
15.9
21.3
5.2
664
135
3Q21
20,201
20,296
20,213
63.2
196,443
156,423
8.62
7.75
4Q20
857.5
15.9
21.5
5.5
678
139
4Q20
20,184
20,272
20,179
30View entire presentation