Snap Inc Results Presentation Deck
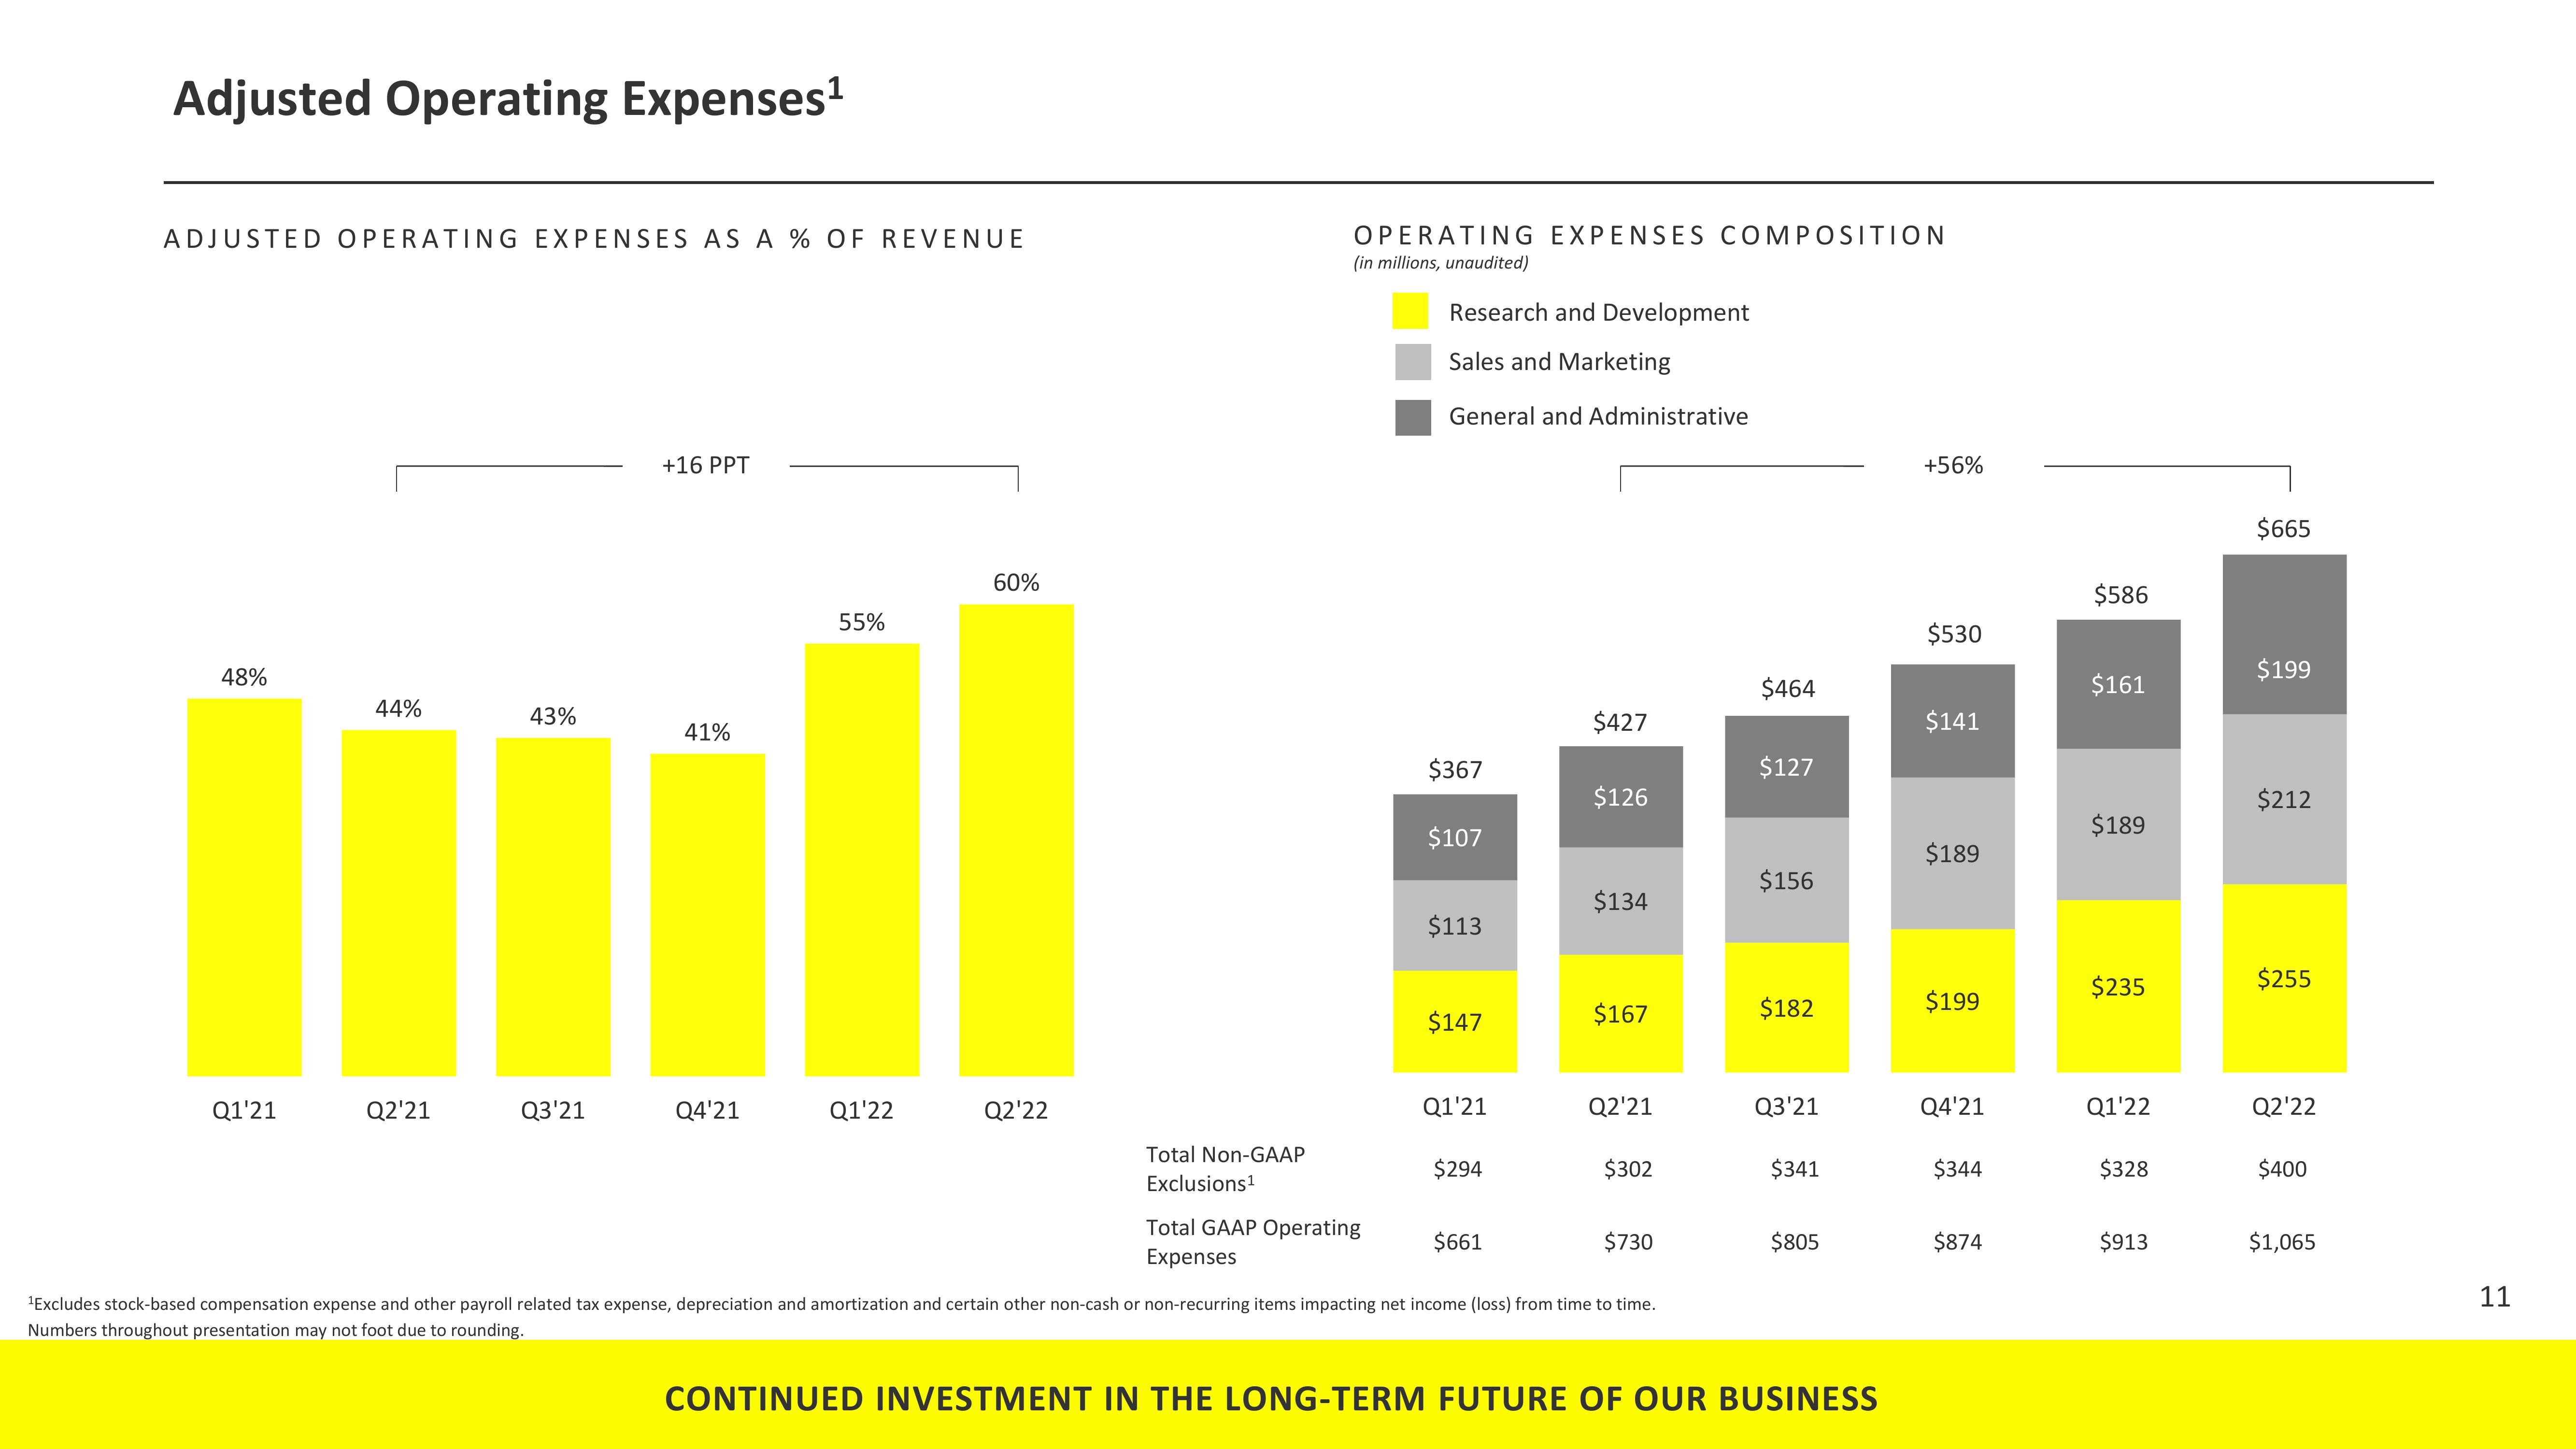
Adjusted Operating Expenses¹
ADJUSTED OPERATING EXPENSES AS A % OF REVENUE
48%
Q1'21
44%
Q2'21
43%
Q3'21
+16 PPT
41%
Q4'21
55%
Q1'22
60%
Q2'22
Total Non-GAAP
Exclusions¹
OPERATING EXPENSES COMPOSITION
(in millions, unaudited)
Research and Development
Sales and Marketing
General and Administrative
Total GAAP Operating
Expenses
$367
$107
$113
$147
Q1'21
$294
$661
$427
$126
$134
$167
Q2'21
$302
$730
¹Excludes stock-based compensation expense and other payroll related tax expense, depreciation and amortization and certain other non-cash or non-recurring items impacting net income (loss) from time to time.
Numbers throughout presentation may not foot due to rounding.
$464
$127
$156
$182
Q3'21
$341
$805
CONTINUED INVESTMENT IN THE LONG-TERM FUTURE OF OUR BUSINESS
+56%
$530
$141
$189
$199
Q4'21
$344
$874
$586
$161
$189
$235
Q1'22
$328
$913
$665
$199
$212
$255
Q2'22
$400
$1,065
11View entire presentation