THOR Industries Results Presentation Deck
QUARTERLY ADJUSTED EBITDA
RECONCILIATION FY 2022
THO
LISTED
NYSE
($ in thousands)
Net Income
Add Back:
Interest Expense, Net
Income Taxes
Depreciation and Amortization
EBITDA
Add Back:
Stock-Based Compensation Expense
Acquisition Related Transaction Costs
Change in LIFO Reserve
Inventory Step-Up Impact on Gross Profit
Net (Income) Expense Related to Certain
Contingent Liabilities
Non-Cash Foreign Currency Loss (Gain)(¹)
$
Other Loss (Gain), Including Sales of
Property, Plant and Equipment
Adjusted EBITDA
Net Sales
Adjusted EBITDA Margin (%)
Total Long-Term Debt as of July 31, 2022 (2)
$
$
Total Long-Term Debt / TTM EBITDA
Total Long-Term Debt / TTM Adjusted EBITDA
1QFY22
244,803
20,720
68,039
64,953
398,515
6,027
1,290
3,350
6,791
22,000
(3,142)
434,831
3,958,224
11.0%
2QFY22
265,635
24,507
80,618
75,895
$ 446,655
$
6,959
315
9,500
(1) Non-cash foreign currency gain related to certain Euro-denominated loans
(2) Total debt obligations as of July 31, 2022 inclusive of the current portion of long-term debt
13,000
(6,036)
$
470,393 $
3,875,018 $
12.1 %
3QFY22
346,018
22,289
116,389
71,646
556,342
9,750
21,000
(2,875)
(6,770)
577,447
4,657,517
12.4 %
4QFY22
FY22
281,787 $ 1,138,243
22,576
90,092
56,575
321,621
71,959
284,453
$ 432,897 $ 1,834,409
8,685
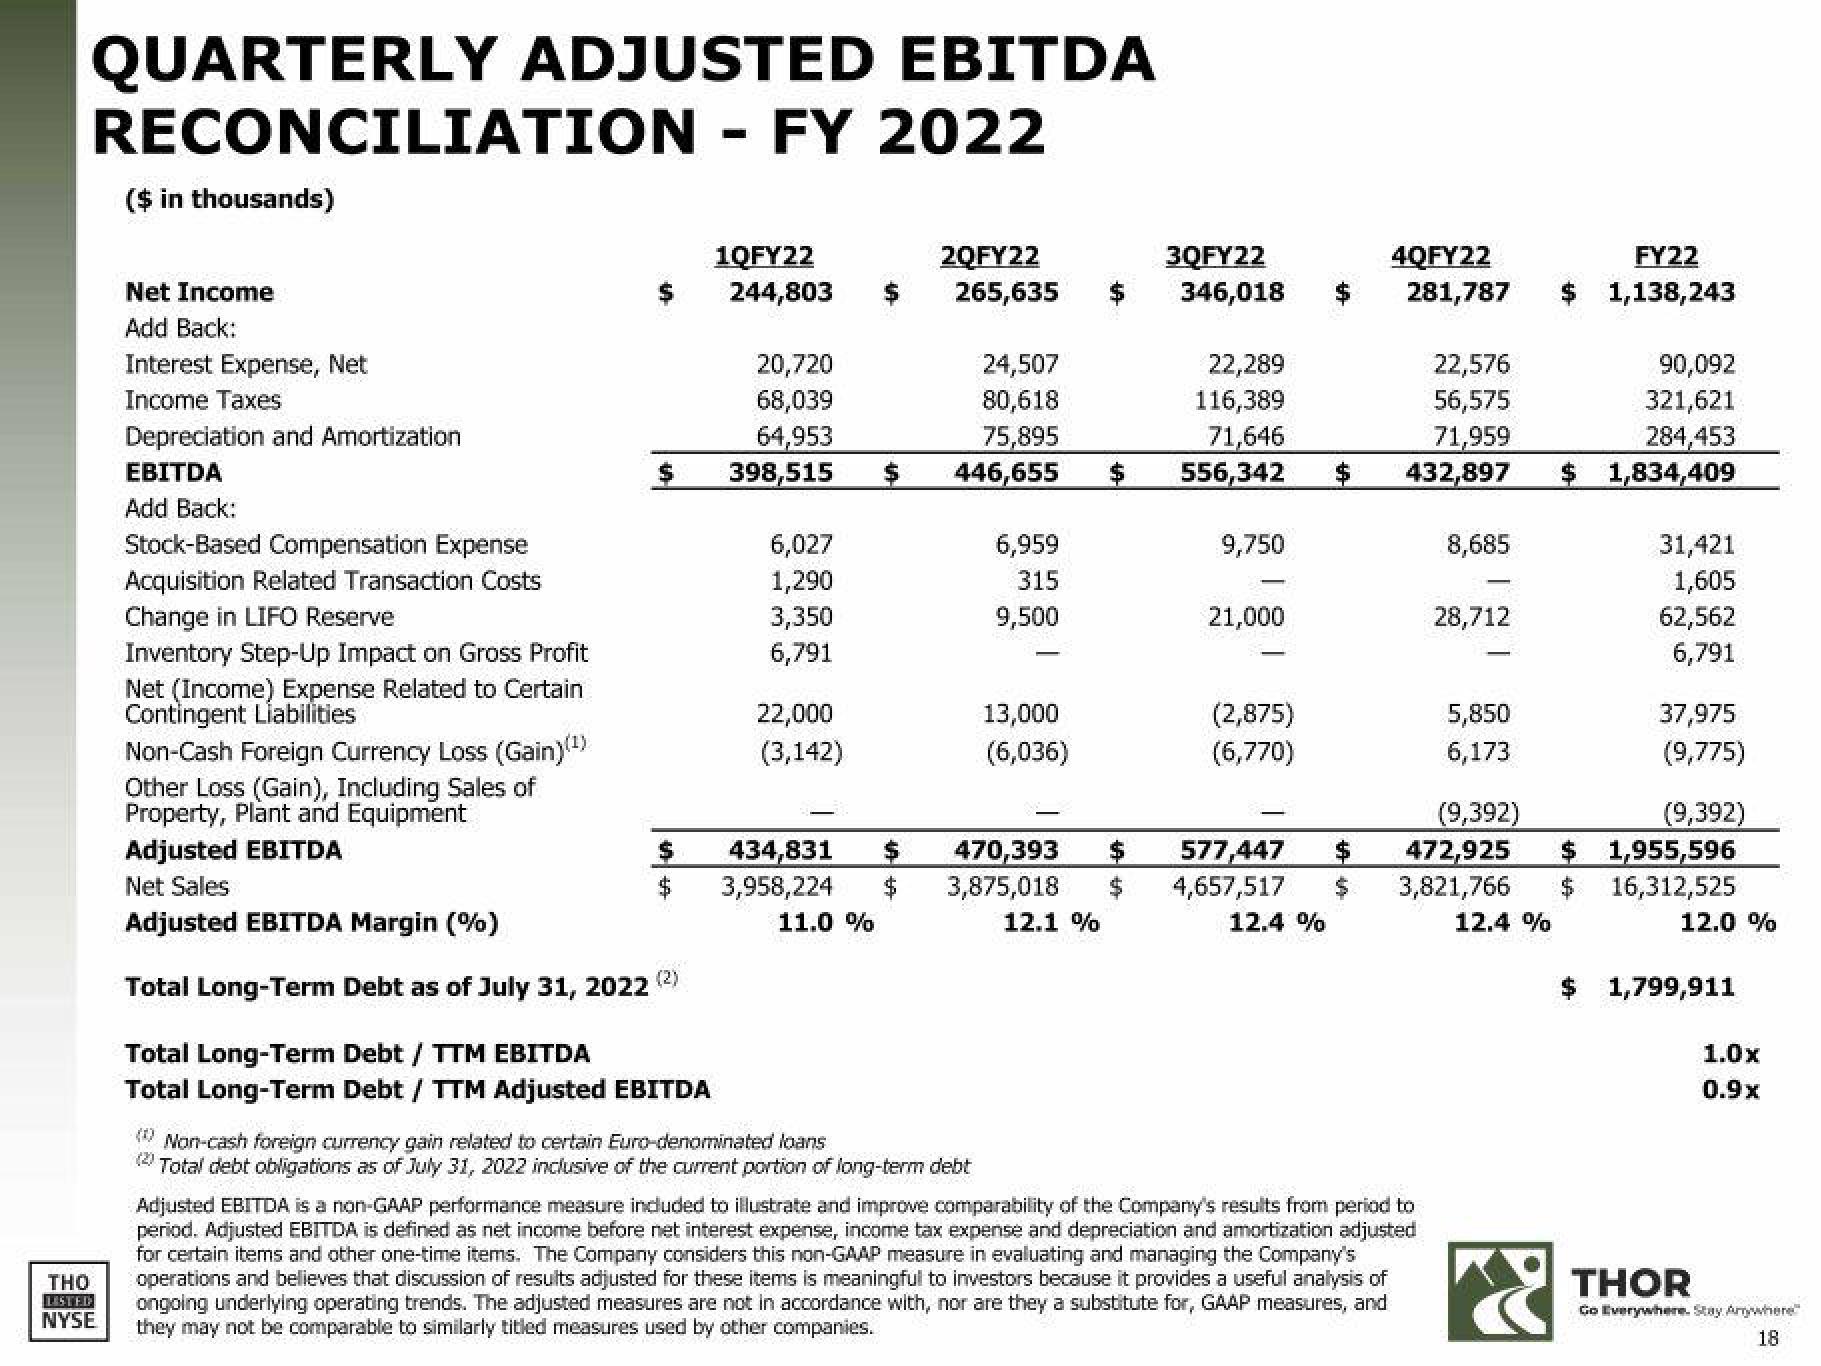
Adjusted EBITDA is a non-GAAP performance measure included to illustrate and improve comparability of the Company's results from period to
period. Adjusted EBITDA is defined as net income before net interest expense, income tax expense and depreciation and amortization adjusted
for certain items and other one-time items. The Company considers this non-GAAP measure in evaluating and managing the Company's
operations and believes that discussion of results adjusted for these items is meaningful to investors because it provides a useful analysis of
ongoing underlying operating trends. The adjusted measures are not in accordance with, nor are they a substitute for, GAAP measures, and
they may not be comparable to similarly titled measures used by other companies.
28,712
5,850
6,173
31,421
1,605
62,562
6,791
(9,392)
(9,392)
472,925 $ 1,955,596
3,821,766 $ 16,312,525
12.4 %
12.0 %
X
37,975
(9,775)
$ 1,799,911
1.0x
0.9x
THOR
Go Everywhere. Stay Anywhere
18View entire presentation