Matson Results Presentation Deck
13
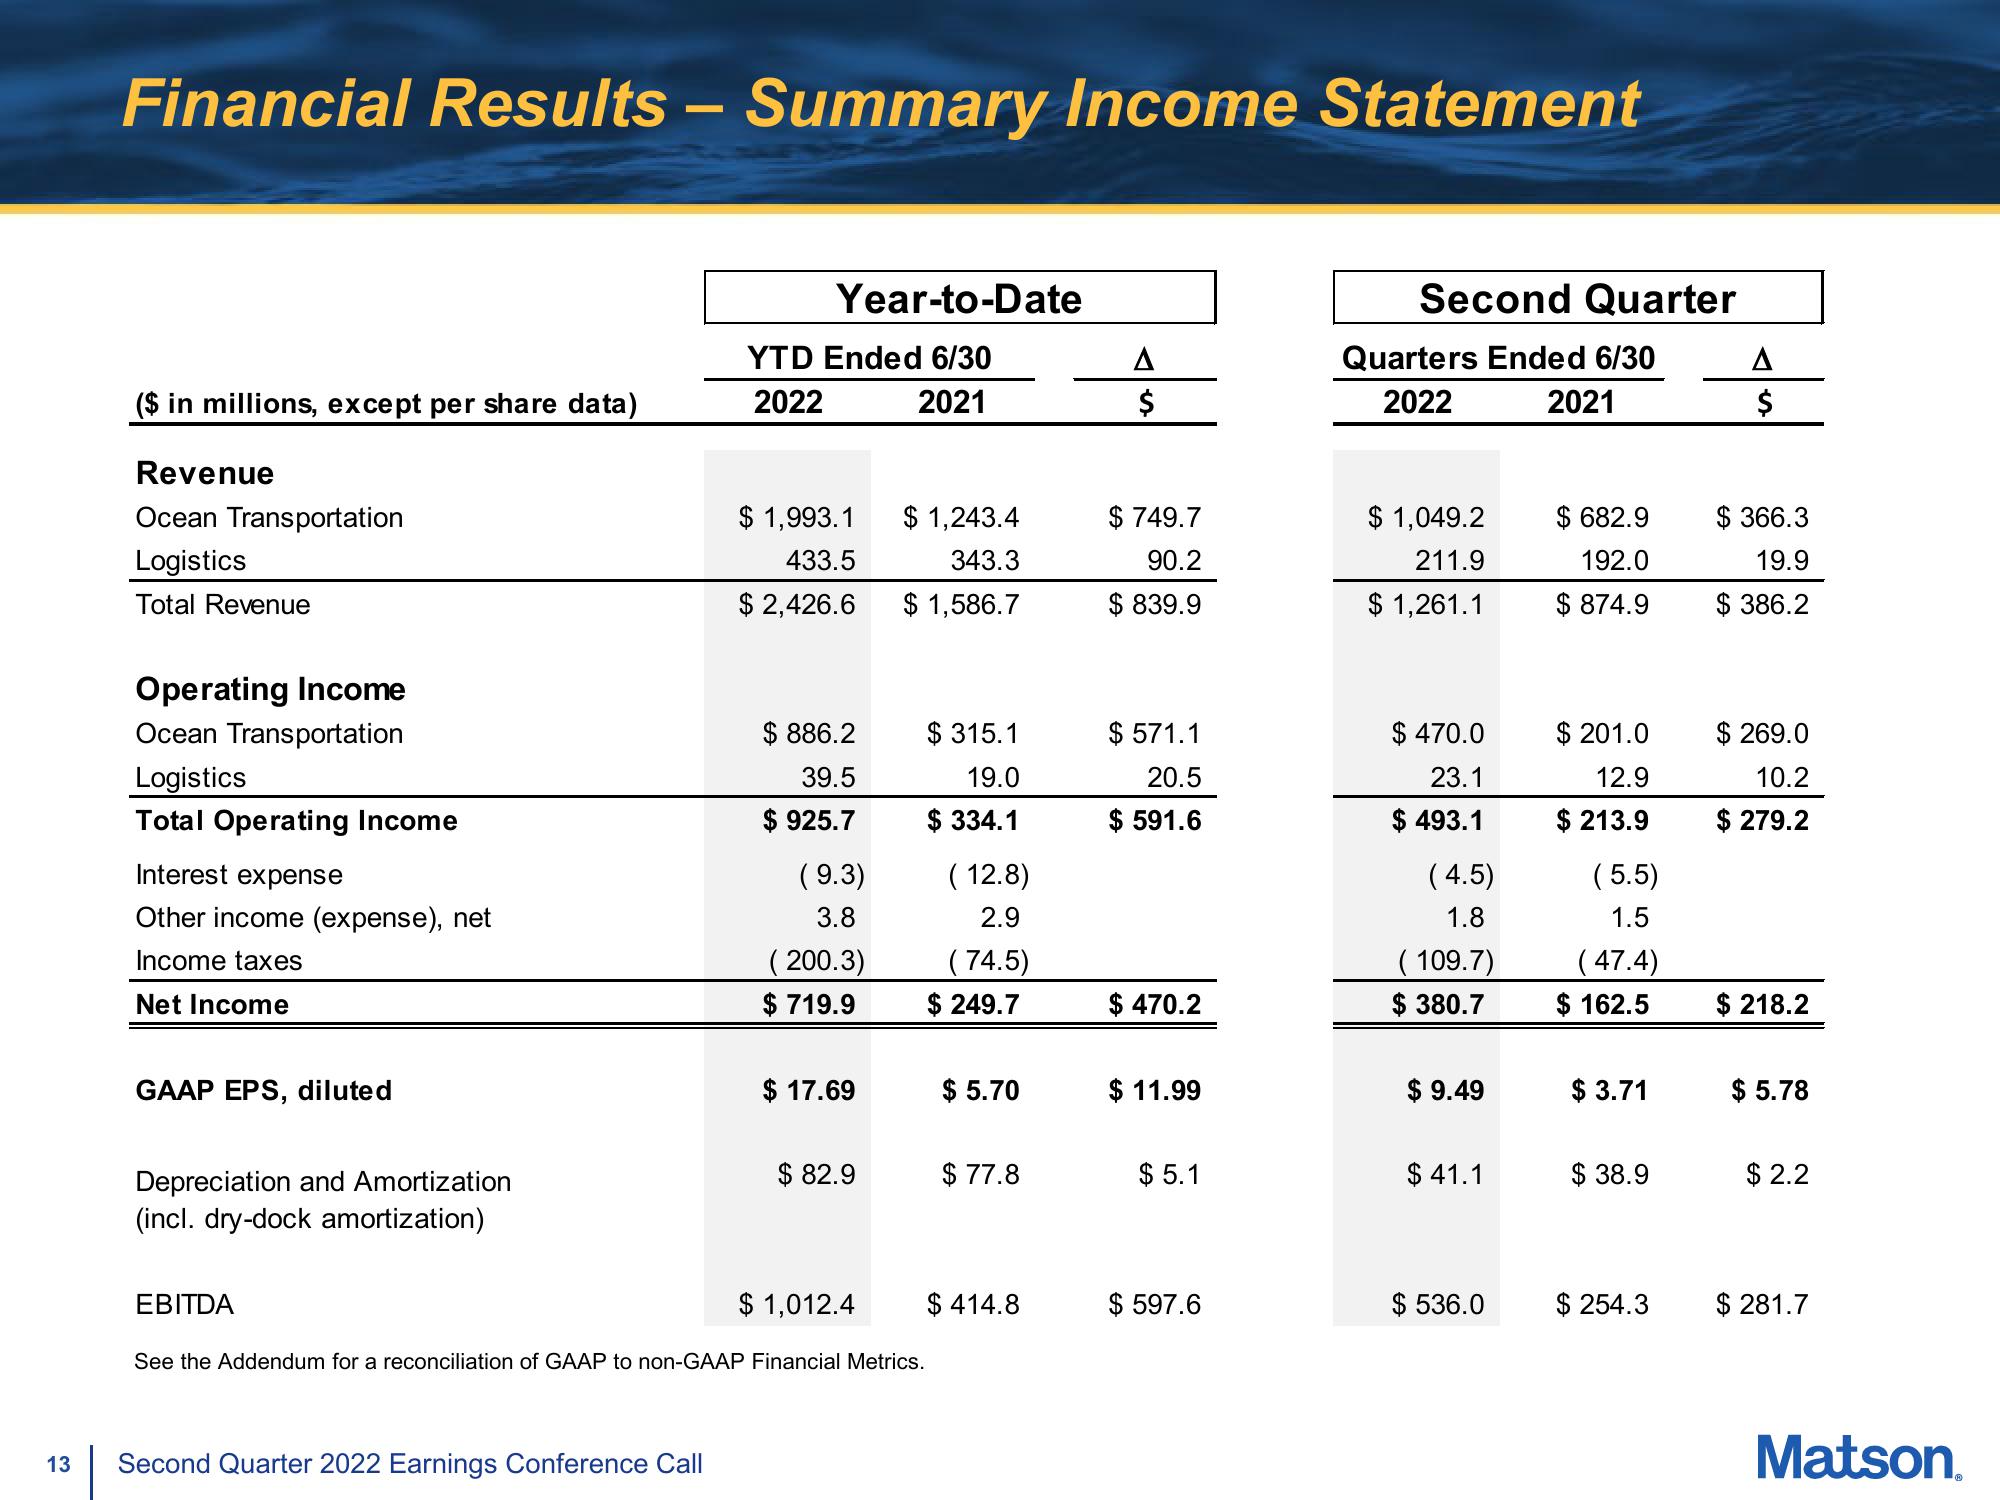
Financial Results - Summary Income Statement
($ in millions, except per share data)
Revenue
Ocean Transportation
Logistics
Total Revenue
Operating Income
Ocean Transportation
Logistics
Total Operating Income
In
est expense
Other income (expense), net
Income taxes
Net Income
GAAP EPS, diluted
Depreciation and Amortization
(incl. dry-dock amortization)
EBITDA
Year-to-Date
Second Quarter 2022 Earnings Conference Call
YTD Ended 6/30
2022
2021
$ 1,993.1
433.5
$ 2,426.6
$ 886.2
39.5
$ 925.7
(9.3)
3.8
(200.3)
$ 719.9
$17.69
$82.9
$ 1,012.4
$ 1,243.4
343.3
$ 1,586.7
See the Addendum for a reconciliation of GAAP to non-GAAP Financial Metrics.
$315.1
19.0
$ 334.1
(12.8)
2.9
(74.5)
$ 249.7
$ 5.70
$77.8
$414.8
A
$
$749.7
90.2
$ 839.9
$571.1
20.5
$ 591.6
$ 470.2
$11.99
$5.1
$ 597.6
Second Quarter
Quarters Ended 6/30
2022
2021
$ 1,049.2
211.9
$1,261.1
$ 470.0
23.1
$ 493.1
(4.5)
1.8
(109.7)
$ 380.7
$9.49
$41.1
$ 536.0
$ 682.9
192.0
$ 874.9
$201.0
12.9
$ 213.9
(5.5)
1.5
(47.4)
$ 162.5
$ 3.71
$38.9
$ 254.3
A
$
$366.3
19.9
$386.2
$ 269.0
10.2
$ 279.2
$ 218.2
$ 5.78
$2.2
$281.7
Matson.View entire presentation