Bed Bath & Beyond Results Presentation Deck
FISCAL 2022
OUTLOOK COMMENTARY
Qualitative Guidance
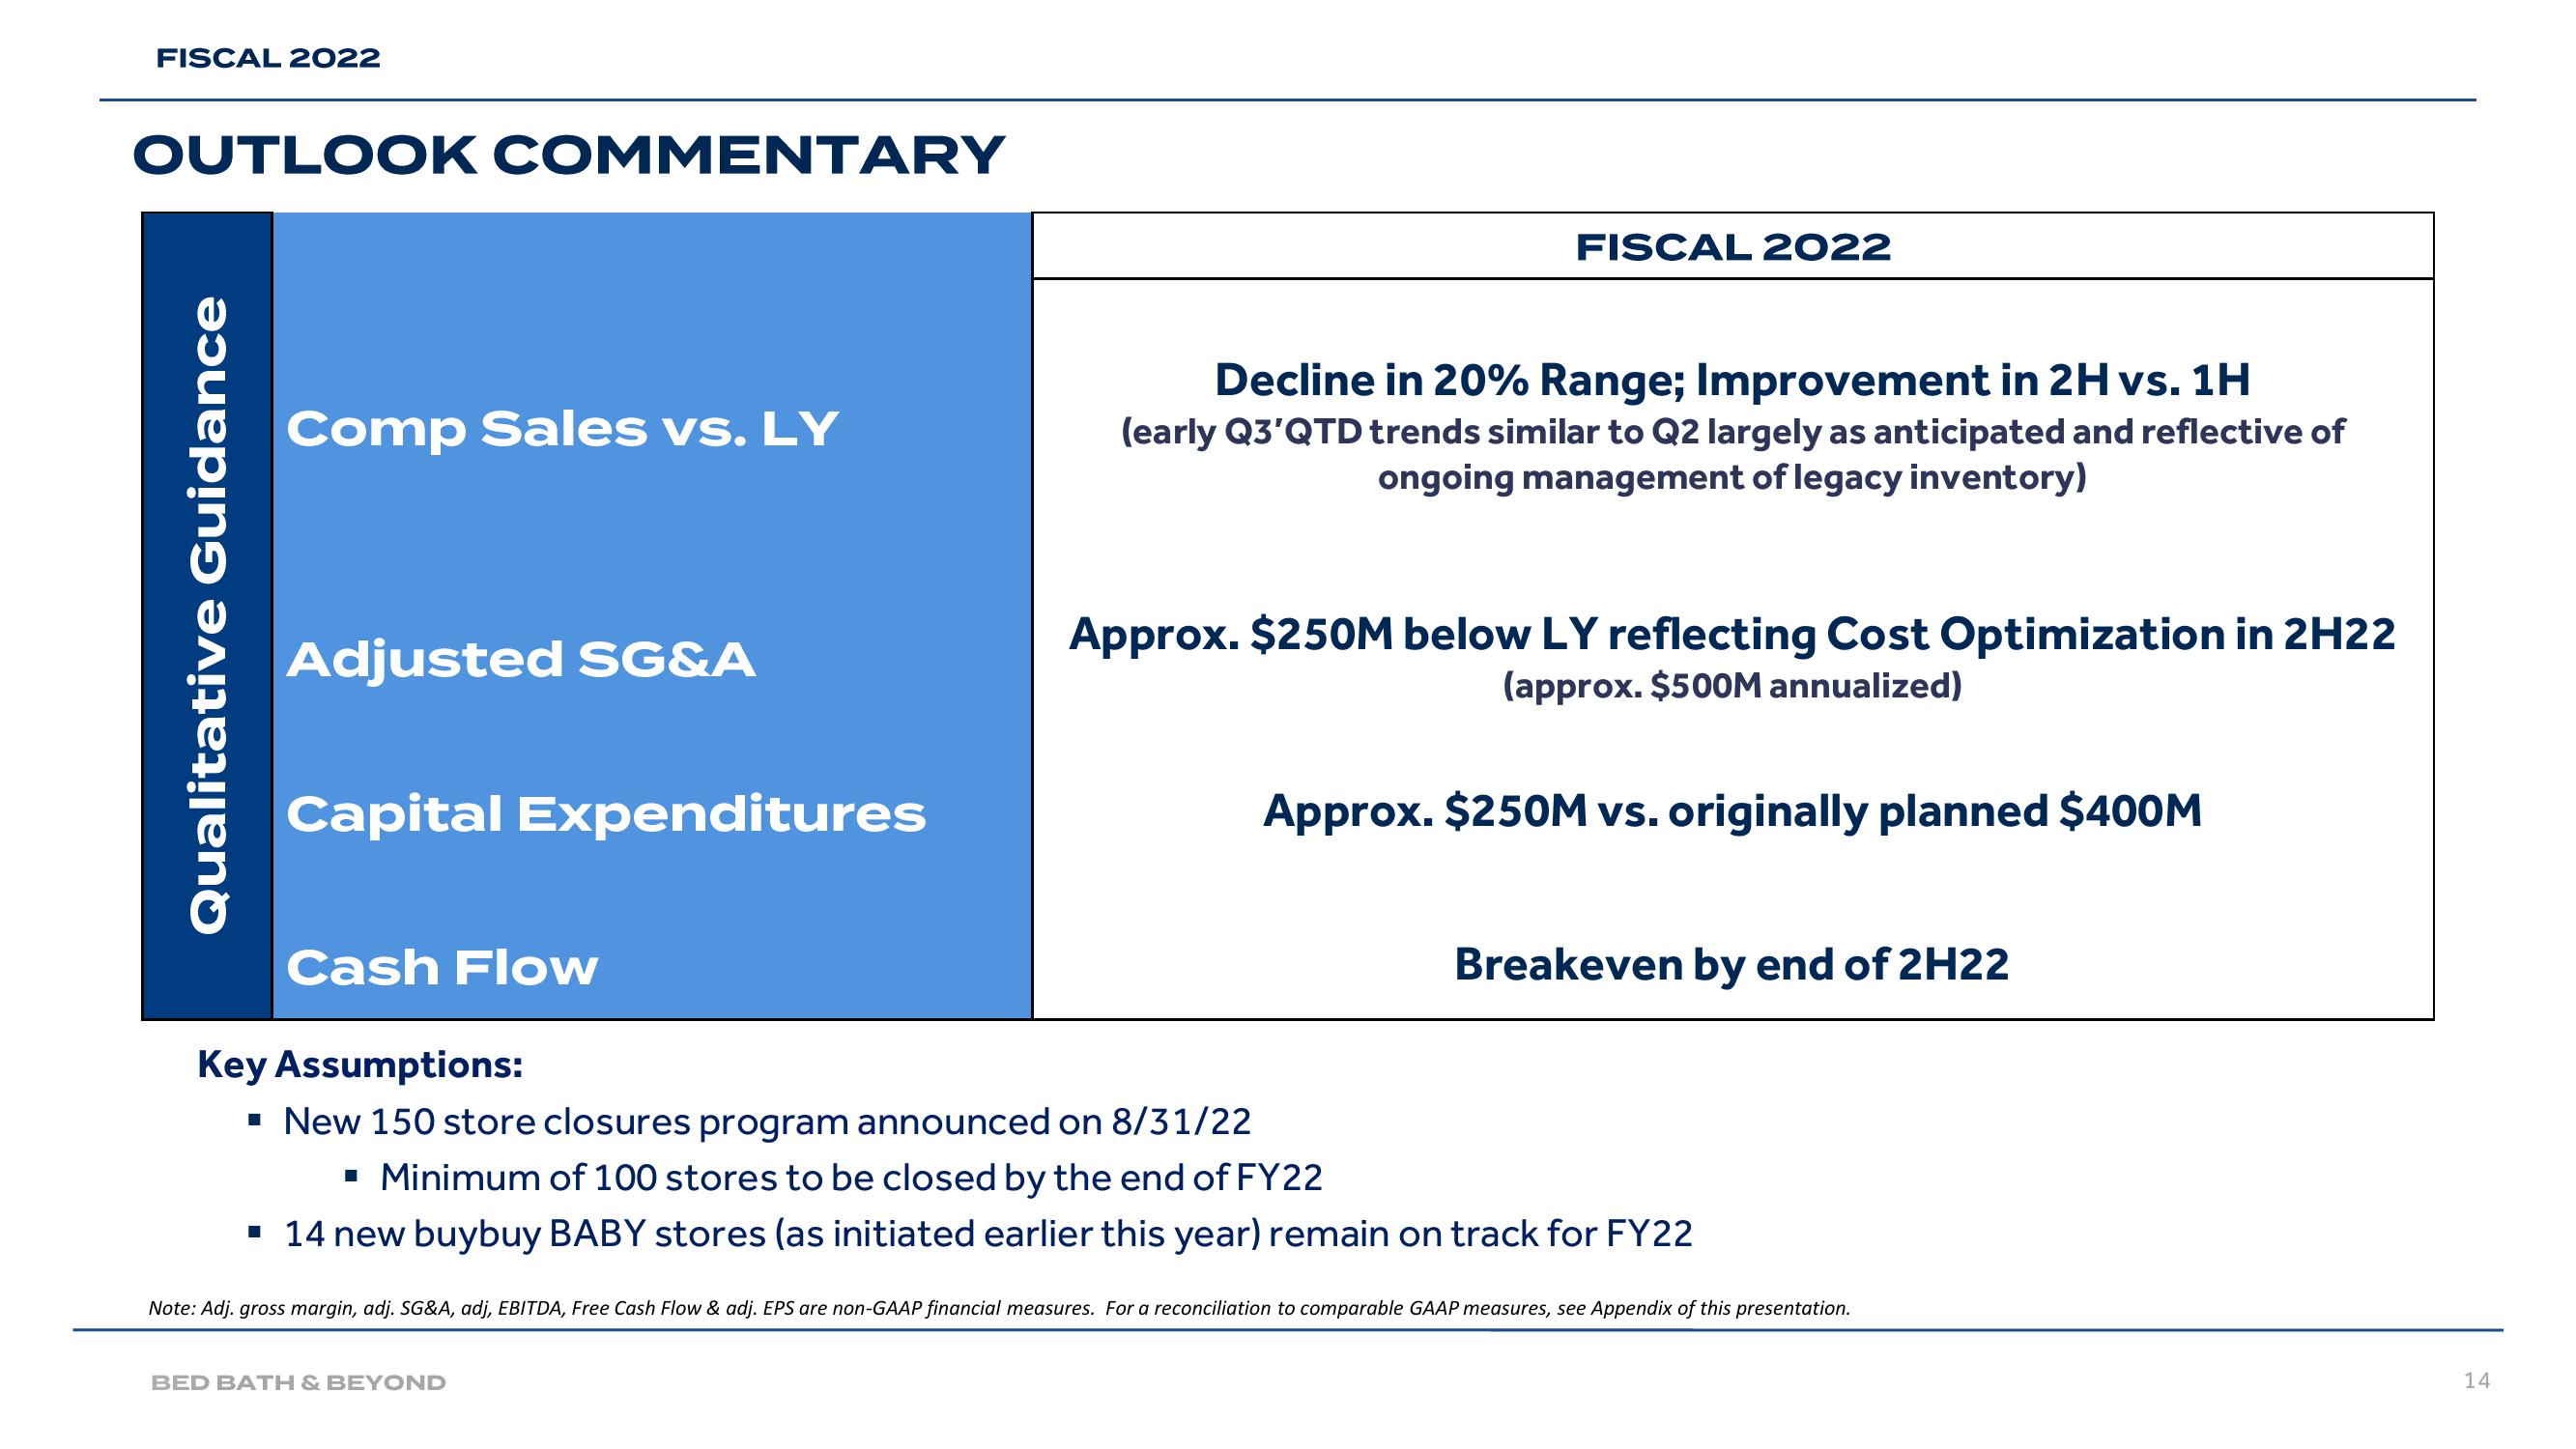
Comp Sales vs. LY
Adjusted SG&A
Capital Expenditures
Cash Flow
FISCAL 2022
Decline in 20% Range; Improvement in 2H vs. 1H
(early Q3'QTD trends similar to Q2 largely as anticipated and reflective of
ongoing management of legacy inventory)
BED BATH & BEYOND
Approx. $250M below LY reflecting Cost Optimization in 2H22
(approx. $500M annualized)
Approx. $250M vs. originally planned $400M
Breakeven by end of 2H22
Key Assumptions:
▪ New 150 store closures program announced on 8/31/22
▪ Minimum of 100 stores to be closed by the end of FY22
▪ 14 new buybuy BABY stores (as initiated earlier this year) remain on track for FY22
Note: Adj. gross margin, adj. SG&A, adj, EBITDA, Free Cash Flow & adj. EPS are non-GAAP financial measures. For a reconciliation to comparable GAAP measures, see Appendix of this presentation.
14View entire presentation