First Busey Results Presentation Deck
2Q23 Earnings Investor Presentation
High Quality Loan Portfolio
Loan Portfolio Composition | 2023
1-4 Family
Residential
19%
$ in millions
C&D
7%
$7,490
$1,884
$466
$3,228
Ex-PPP Loans Trends
LTM Core Growth
+4.2%
$7,669
$1,912
HELOC
3%
Other
4%
2022 Q2
Total Loan
Portfolio:
$7.8
Billion
Non-Owner
Occupied CRE
31%
$1,946
$500
$3,279
Commercial
& Industrial
24%
$1,944
3
Owner
Occupied
CRE
12%
$7,725
$1,959
$530
$3,262
First Busey Corporation | Ticker: BUSE
$1,974
MRQ Yield on Loans
4.92%
2Q23 Net New Funding Yield
6.65%
Classified Loans / Capital ¹
5.7%
New Originations YTD
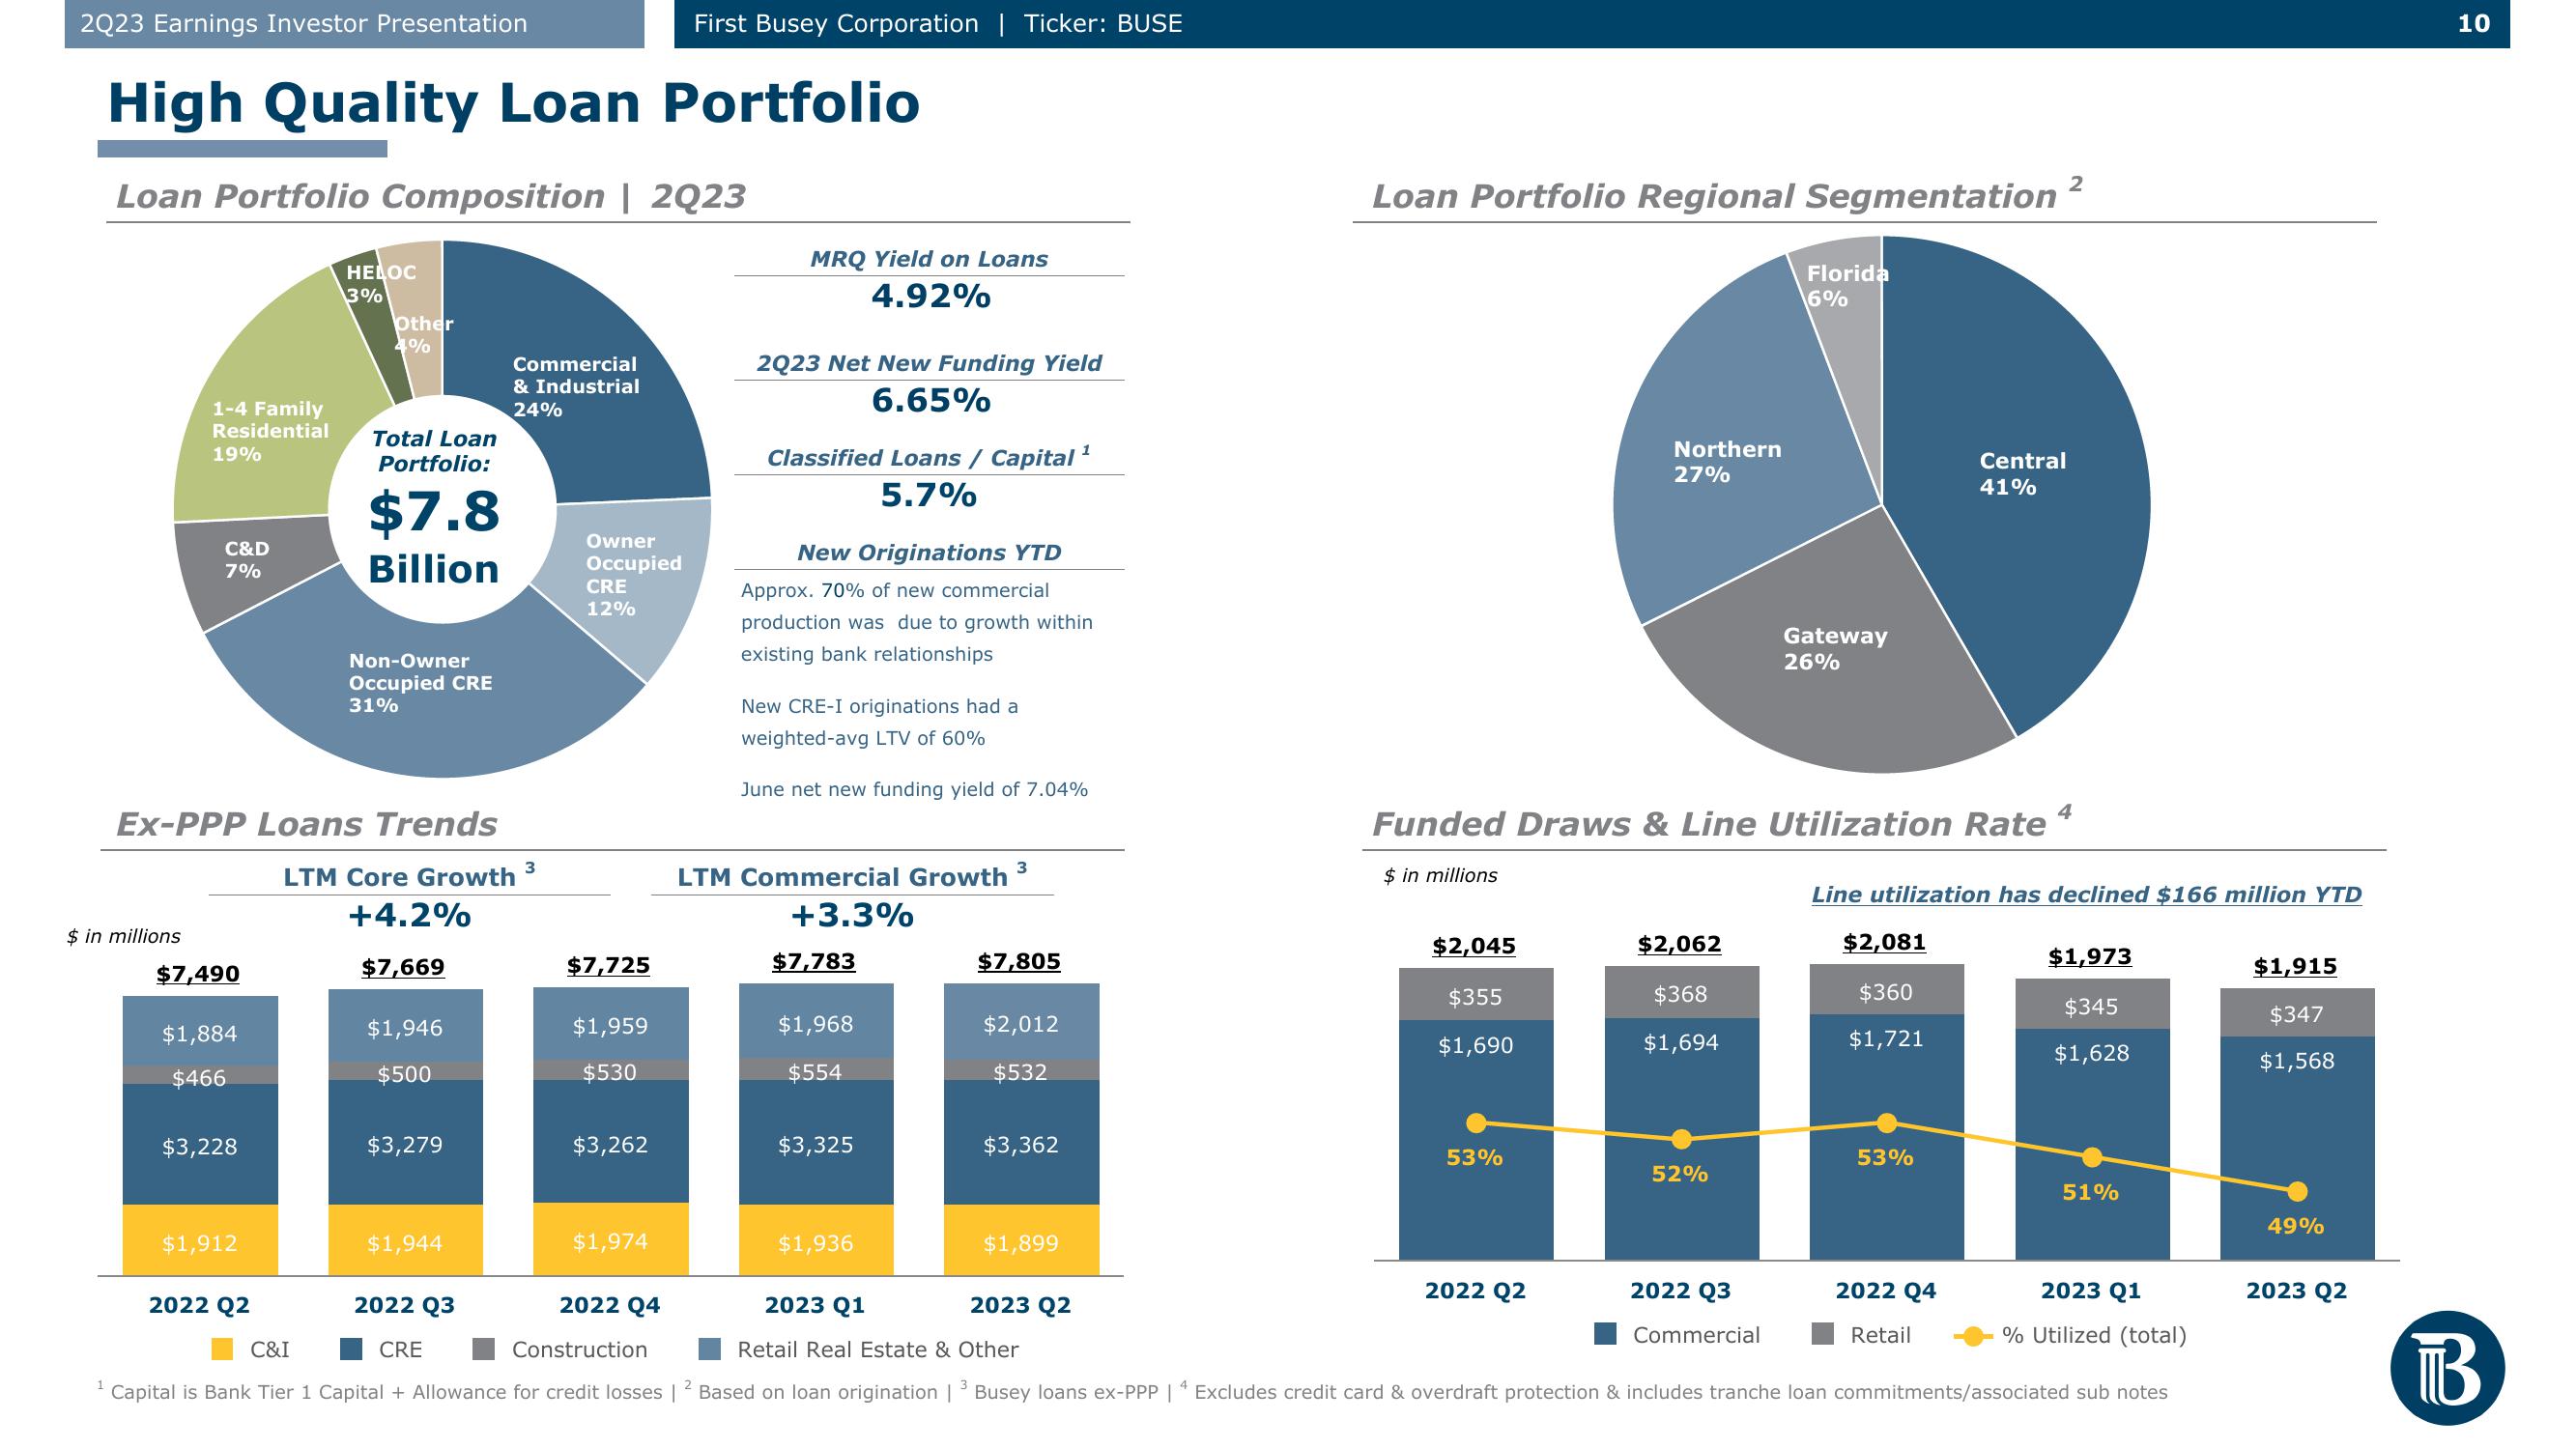
Approx. 70% of new commercial
production was due to growth within
existing bank relationships
New CRE-I originations had a
weighted-avg LTV of 60%
June net new funding yield of 7.04%
LTM Commercial Growth
+3.3%
$7,783
$1,968
$554
$3,325
$1,936
3
$7,805
$2,012
$532
$3,362
$1,899
Loan Portfolio Regional Segmentation
2023 Q2
$ in millions
$2,045
$355
$1,690
53%
Northern
27%
2022 Q2
Funded Draws & Line Utilization Rate 4
$2,062
$368
$1,694
52%
Florida
6%
2022 Q3
Commercial
Gateway
26%
$2,081
$360
$1,721
Central
41%
Line utilization has declined $166 million YTD
53%
2
2022 Q4
Retail
$1,973
$345
$1,628
51%
2023 Q1
2022 Q3
CRE
2022 Q4
Construction
C&I
Retail Real Estate & Other
1 Capital is Bank Tier 1 Capital + Allowance for credit losses | ² Based on loan origination | 3 Busey loans ex-PPP | Excludes credit card & overdraft protection & includes tranche loan commitments/associated sub notes
2023 Q1
% Utilized (total)
$1,915
$347
$1,568
49%
2023 Q2
10
ТВView entire presentation