Maersk Results Presentation Deck
Maersk Group
- Interim Report 03 2015
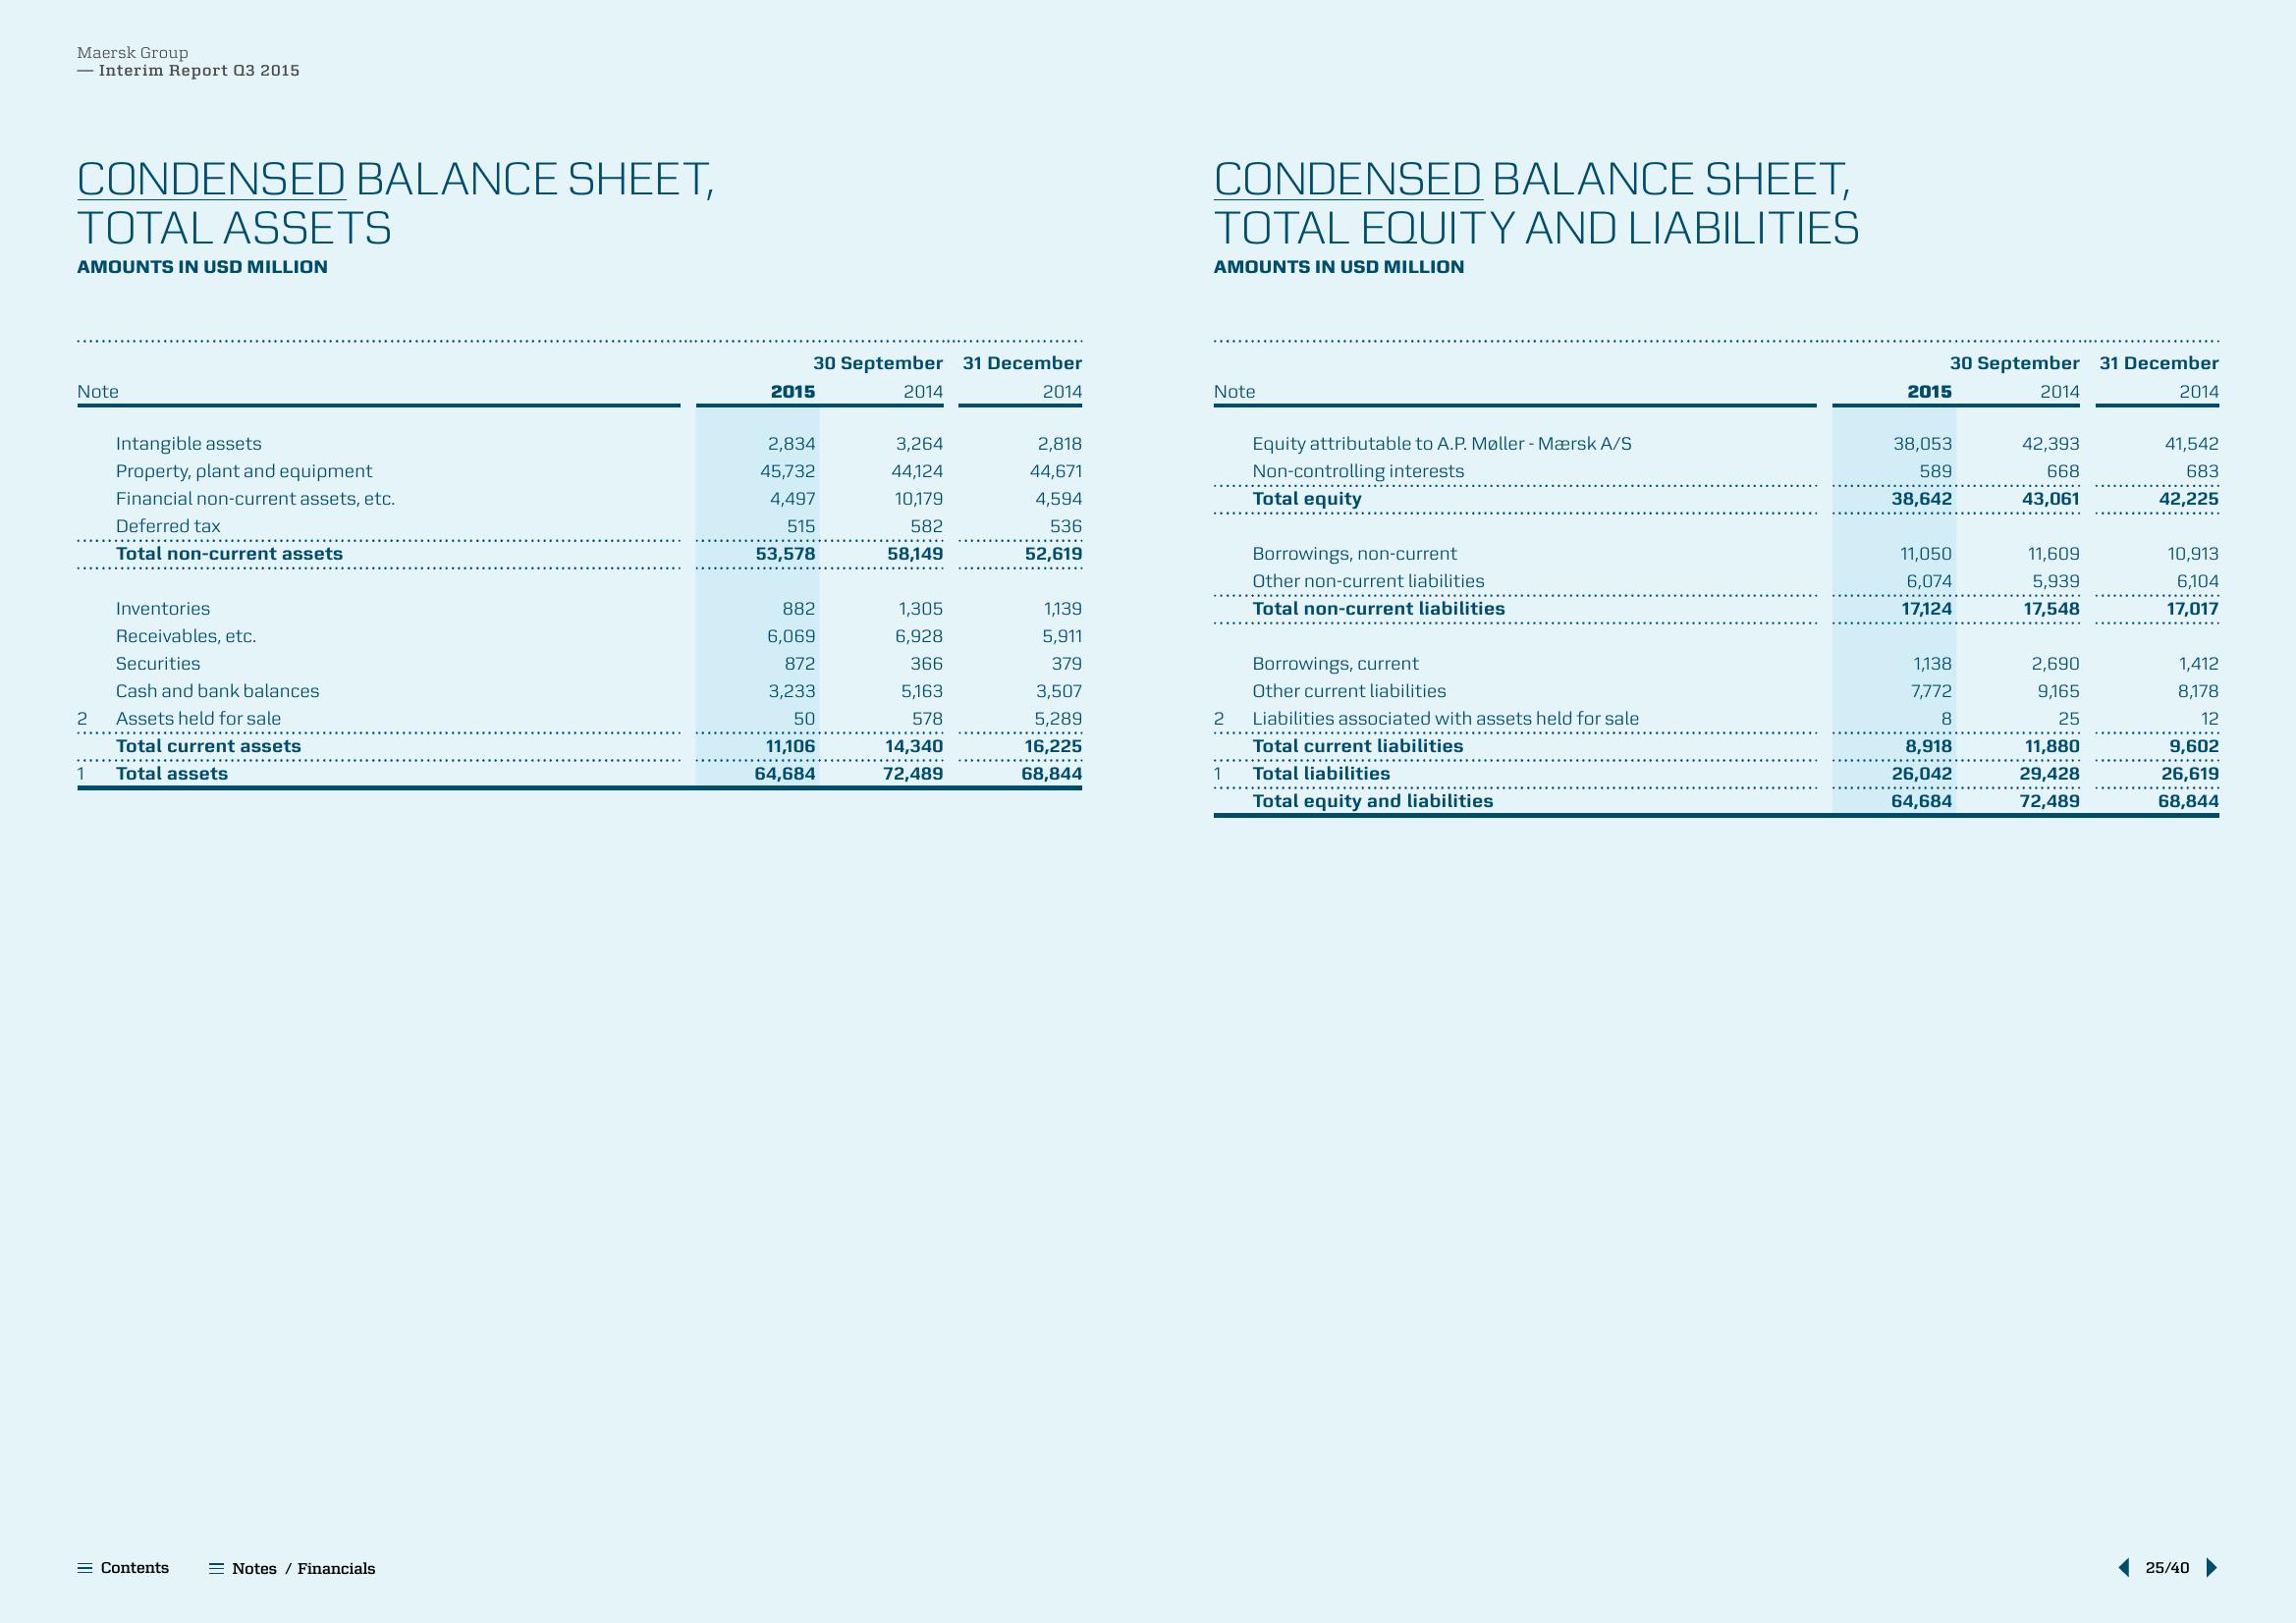
CONDENSED BALANCE SHEET,
TOTAL ASSETS
AMOUNTS IN USD MILLION
Note
2
1
Intangible assets
Property, plant and equipment
Financial non-current assets, etc.
Deferred tax
Total non-current assets
Inventories
Receivables, etc.
Securities
Cash and bank balances
Assets held for sale
Total current assets
Total assets
**********
= Contents
Notes / Financials
30 September 31 December
2014
2015
2,834
45,732
4,497
515
53,578
882
6,069
872
3,233
50
11,106
64,684
2014
3,264
44,124
10,179
582
58,149
1,305
6,928
366
5,163
578
14,340
72,489
2,818
44,671
4,594
536
52,619
1,139
5,911
379
3,507
5,289
16,225
68,844
CONDENSED BALANCE SHEET,
TOTAL EQUITY AND LIABILITIES
AMOUNTS IN USD MILLION
Note
2
1
Equity attributable to A.P. Møller-Mærsk A/S
Non-controlling interests
Total equity
Borrowings, non-current
Other non-current liabilities
Total non-current liabilities
Borrowings, current
Other current liabilities
Liabilities associated with assets held for sale
***********..
Total current liabilities
Total liabilities
Total equity and liabilities
30 September 31 December
2014
2015
38,053
589
38,642
11,050
6,074
17,124
1,138
7,772
8
8,918
26,042
64,684
2014
42,393
668
43,061
11,609
5,939
17,548
2,690
9,165
25
11,880
29,428
72,489
41,542
683
42,225
10,913
6,104
17,017
1,412
8,178
12
9,602
26,619
68,844
25/40View entire presentation