4th Quarter and Full Fiscal Year 2018 Financial Results & Germane Systems Acquisition Overview
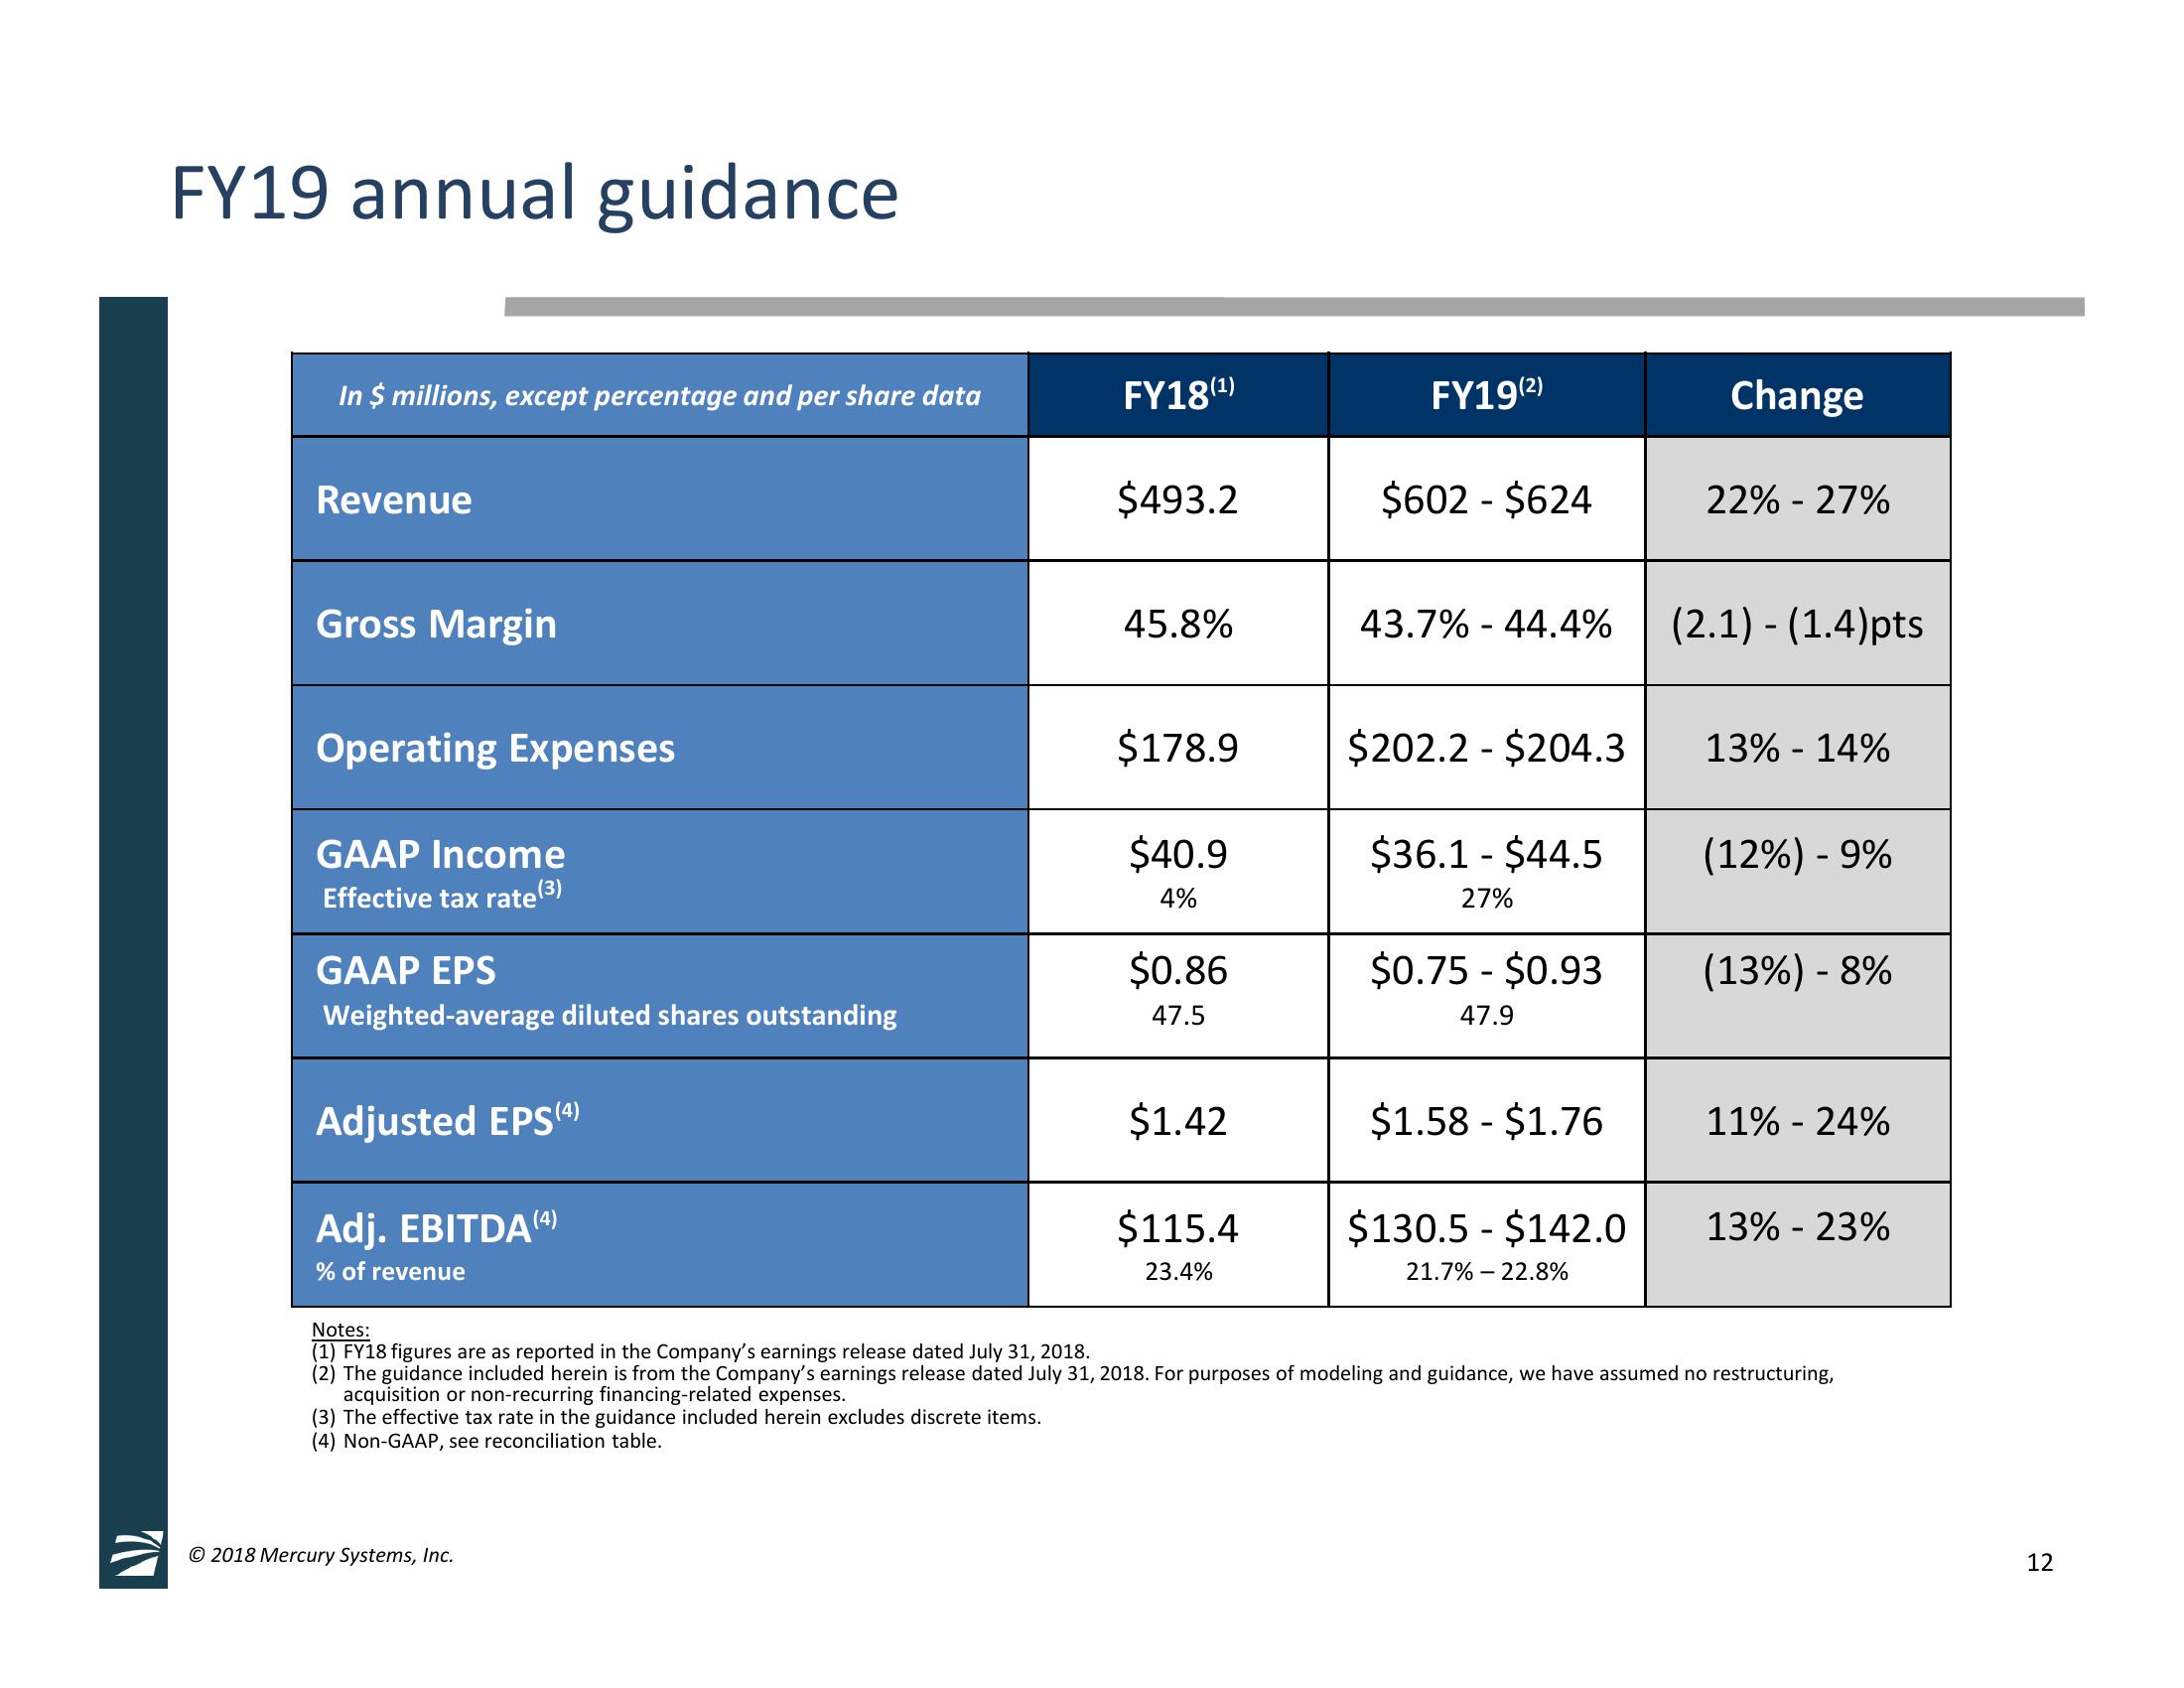
FY19 annual guidance
In $ millions, except percentage and per share data
Revenue
Gross Margin
Operating Expenses
GAAP Income
Effective tax rate (³)
GAAP EPS
Weighted-average diluted shares outstanding
Adjusted EPS (4)
Adj. EBITDA (4)
% of revenue
FY18 (¹)
© 2018 Mercury Systems, Inc.
$493.2
45.8%
$178.9
$40.9
4%
$0.86
47.5
$1.42
$115.4
23.4%
FY19(²)
$602 - $624
43.7% -44.4%
$202.2 - $204.3
$36.1 - $44.5
27%
$0.75 - $0.93
47.9
$1.58 - $1.76
$130.5 - $142.0
21.7% 22.8%
Change
22% -27%
(2.1) - (1.4)pts
13% -14%
(12%) - 9%
(13%) - 8%
11% -24%
13% -23%
Notes:
(1) FY18 figures are as reported in the Company's earnings release dated July 31, 2018.
(2) The guidance included herein is from the Company's earnings release dated July 31, 2018. For purposes of modeling and guidance, we have assumed no restructuring,
acquisition or non-recurring financing-related expenses.
(3) The effective tax rate in the guidance included herein excludes discrete items.
(4) Non-GAAP, see reconciliation table.
12View entire presentation