Grove Investor Presentation Deck
(in millions except ratios)
Percent Change
Shares Outstanding (1)
Price / Share (2)
Market Cap
Less: 6/30/23 Net Cash (3)
Total Enterprise Value
TEV/2022 Sales
TEV / 2023 Sales
-75%
36
$0.44
$16
11
$5
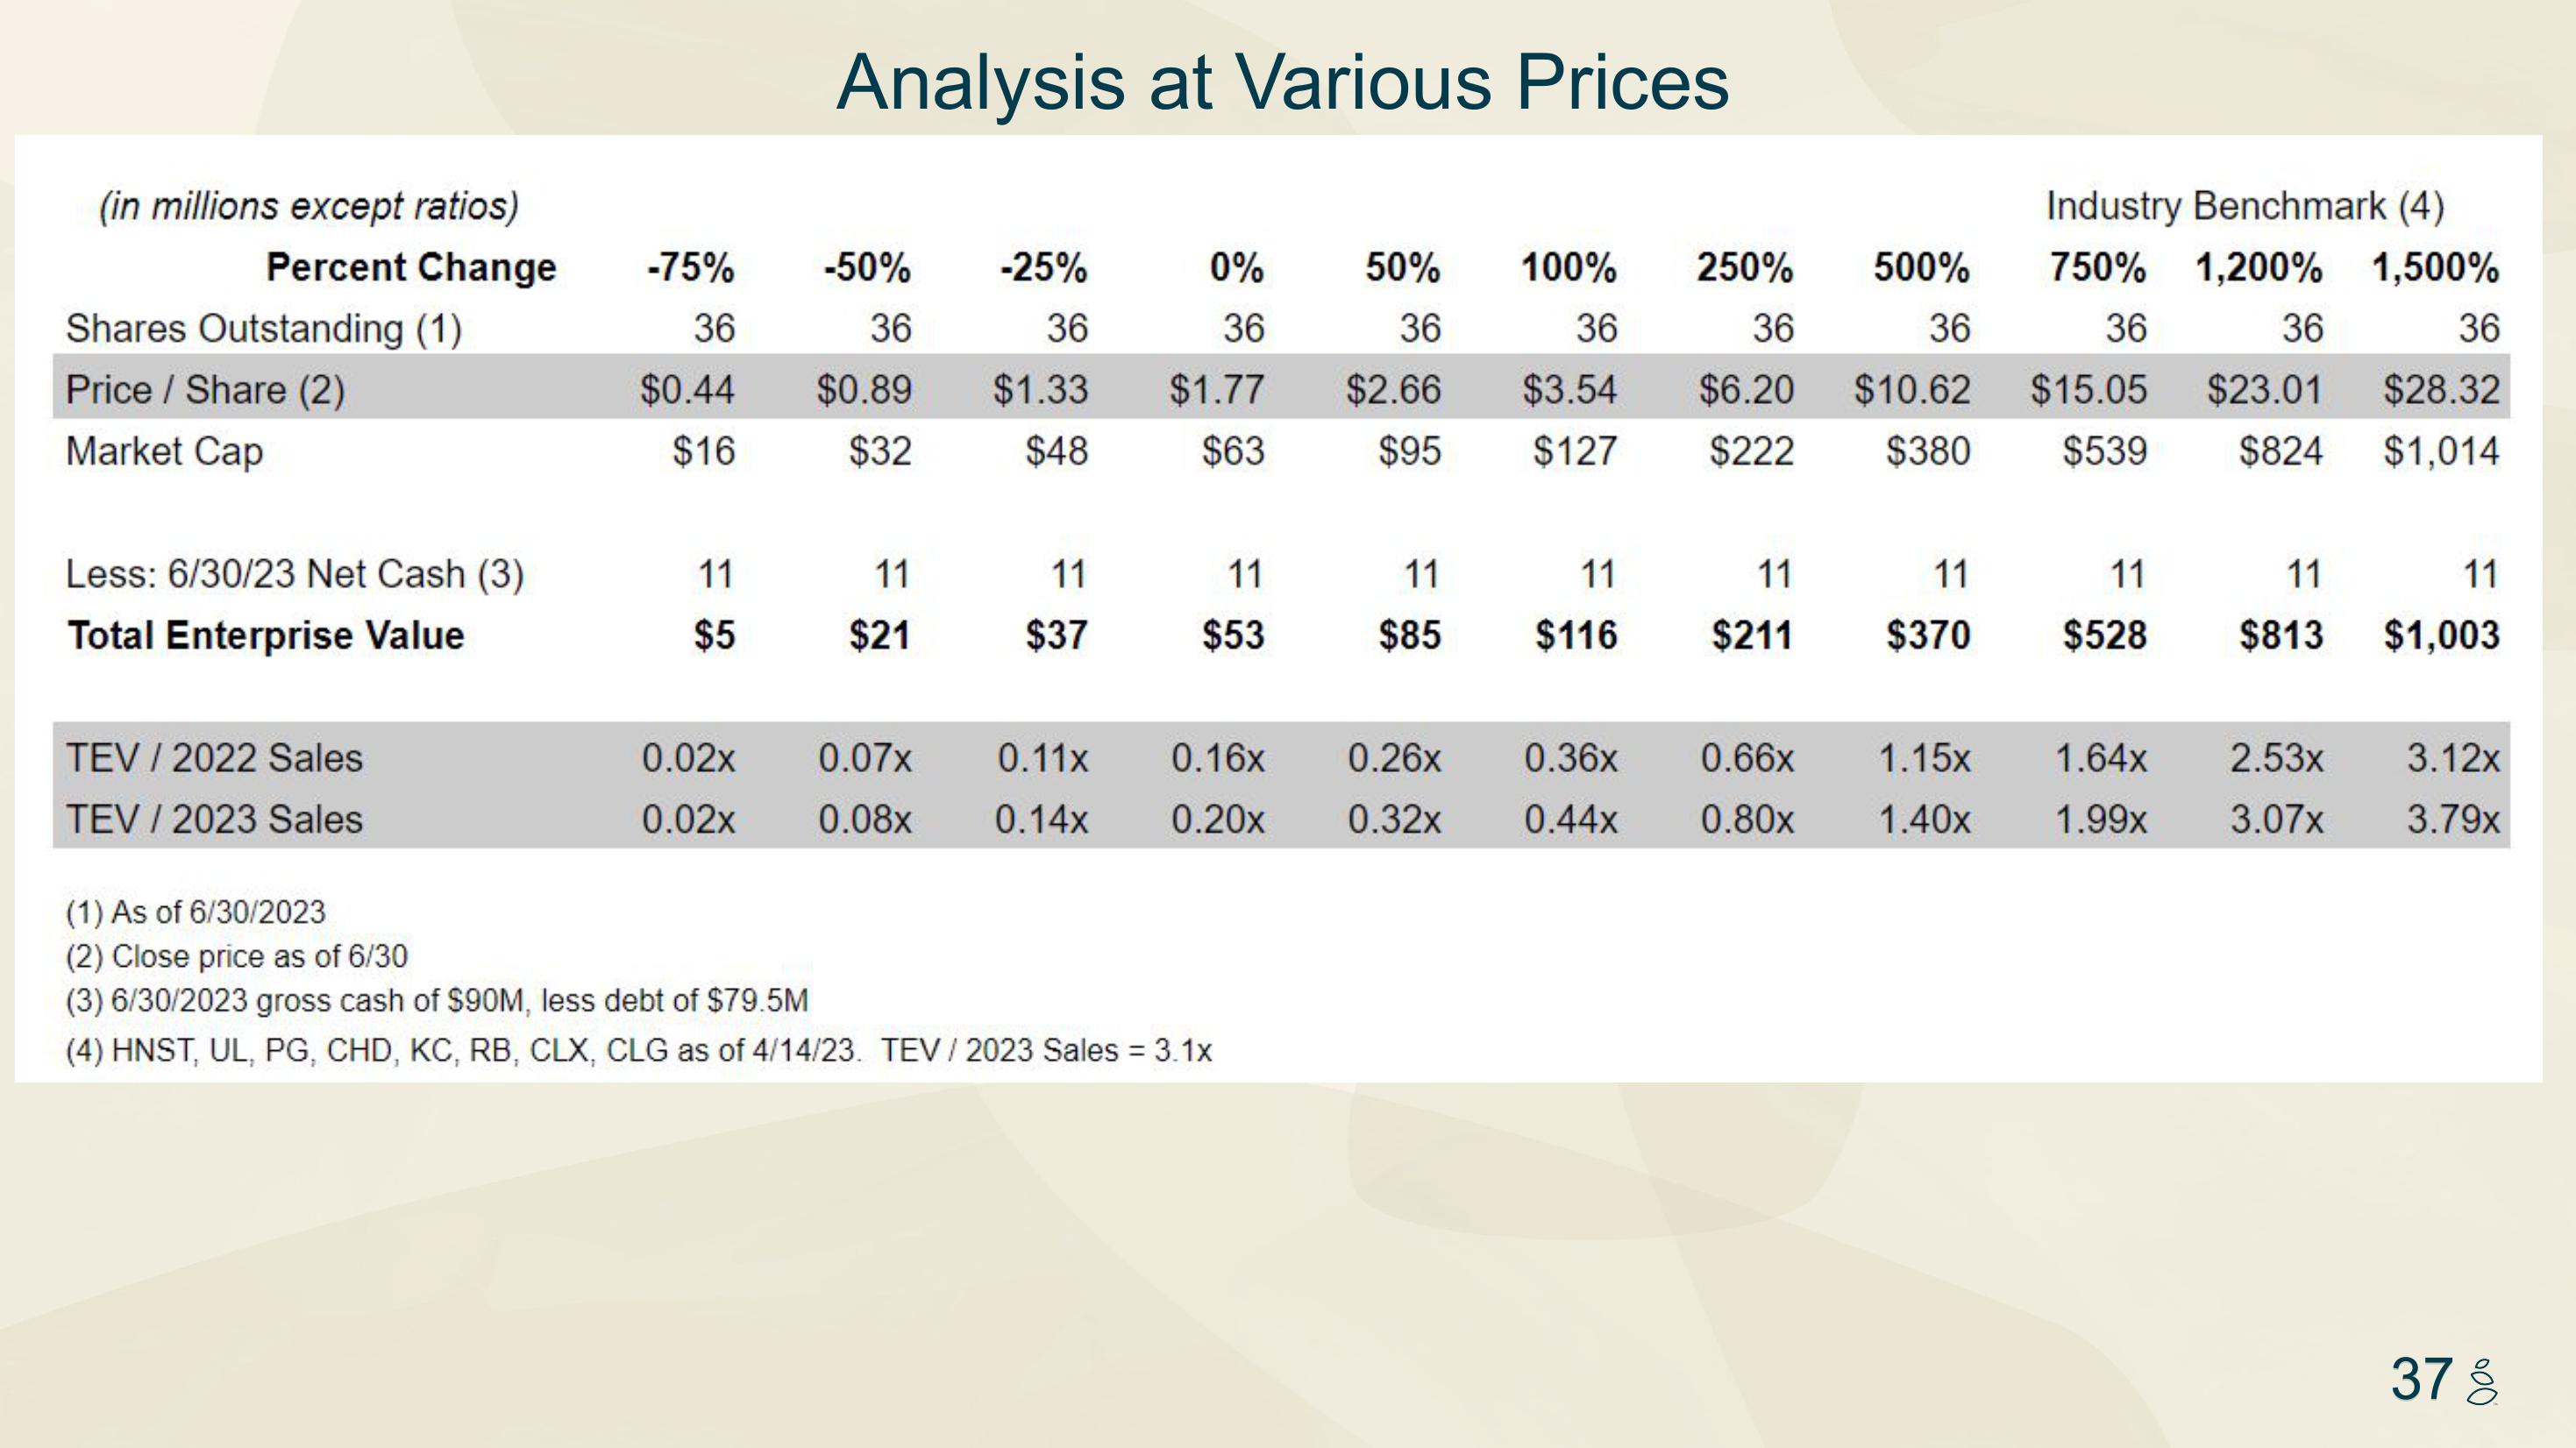
Analysis at Various Prices
-50%
36
$0.89
$32
11
$21
-25%
36
$1.33
$48
11
$37
0%
36
$1.77
$63
11
$53
0.02x 0.07x 0.11x 0.16x
0.02x 0.08x 0.14x 0.20x
(1) As of 6/30/2023
(2) Close price as of 6/30
(3) 6/30/2023 gross cash of $90M, less debt of $79.5M
(4) HNST, UL, PG, CHD, KC, RB, CLX, CLG as of 4/14/23. TEV/2023 Sales = 3.1x
50%
36
$2.66
100% 250%
36
$3.54 $6.20
36
$95 $127
11
$85
11
$116
500%
36
$10.62
$222 $380
11
$211
0.26x 0.36x
0.66x
0.32x 0.44x 0.80x
11
$370
Industry Benchmark (4)
750% 1,200% 1,500%
36
36
$15.05
$539
36
$23.01
$28.32
$1,014
$824
11
$528
11
$813
1.64x 2.53x
1.15x
1.40x 1.99x 3.07x
11
$1,003
3.12x
3.79x
37 8View entire presentation