Barclays Capital 2010 Global Financial Services Conference
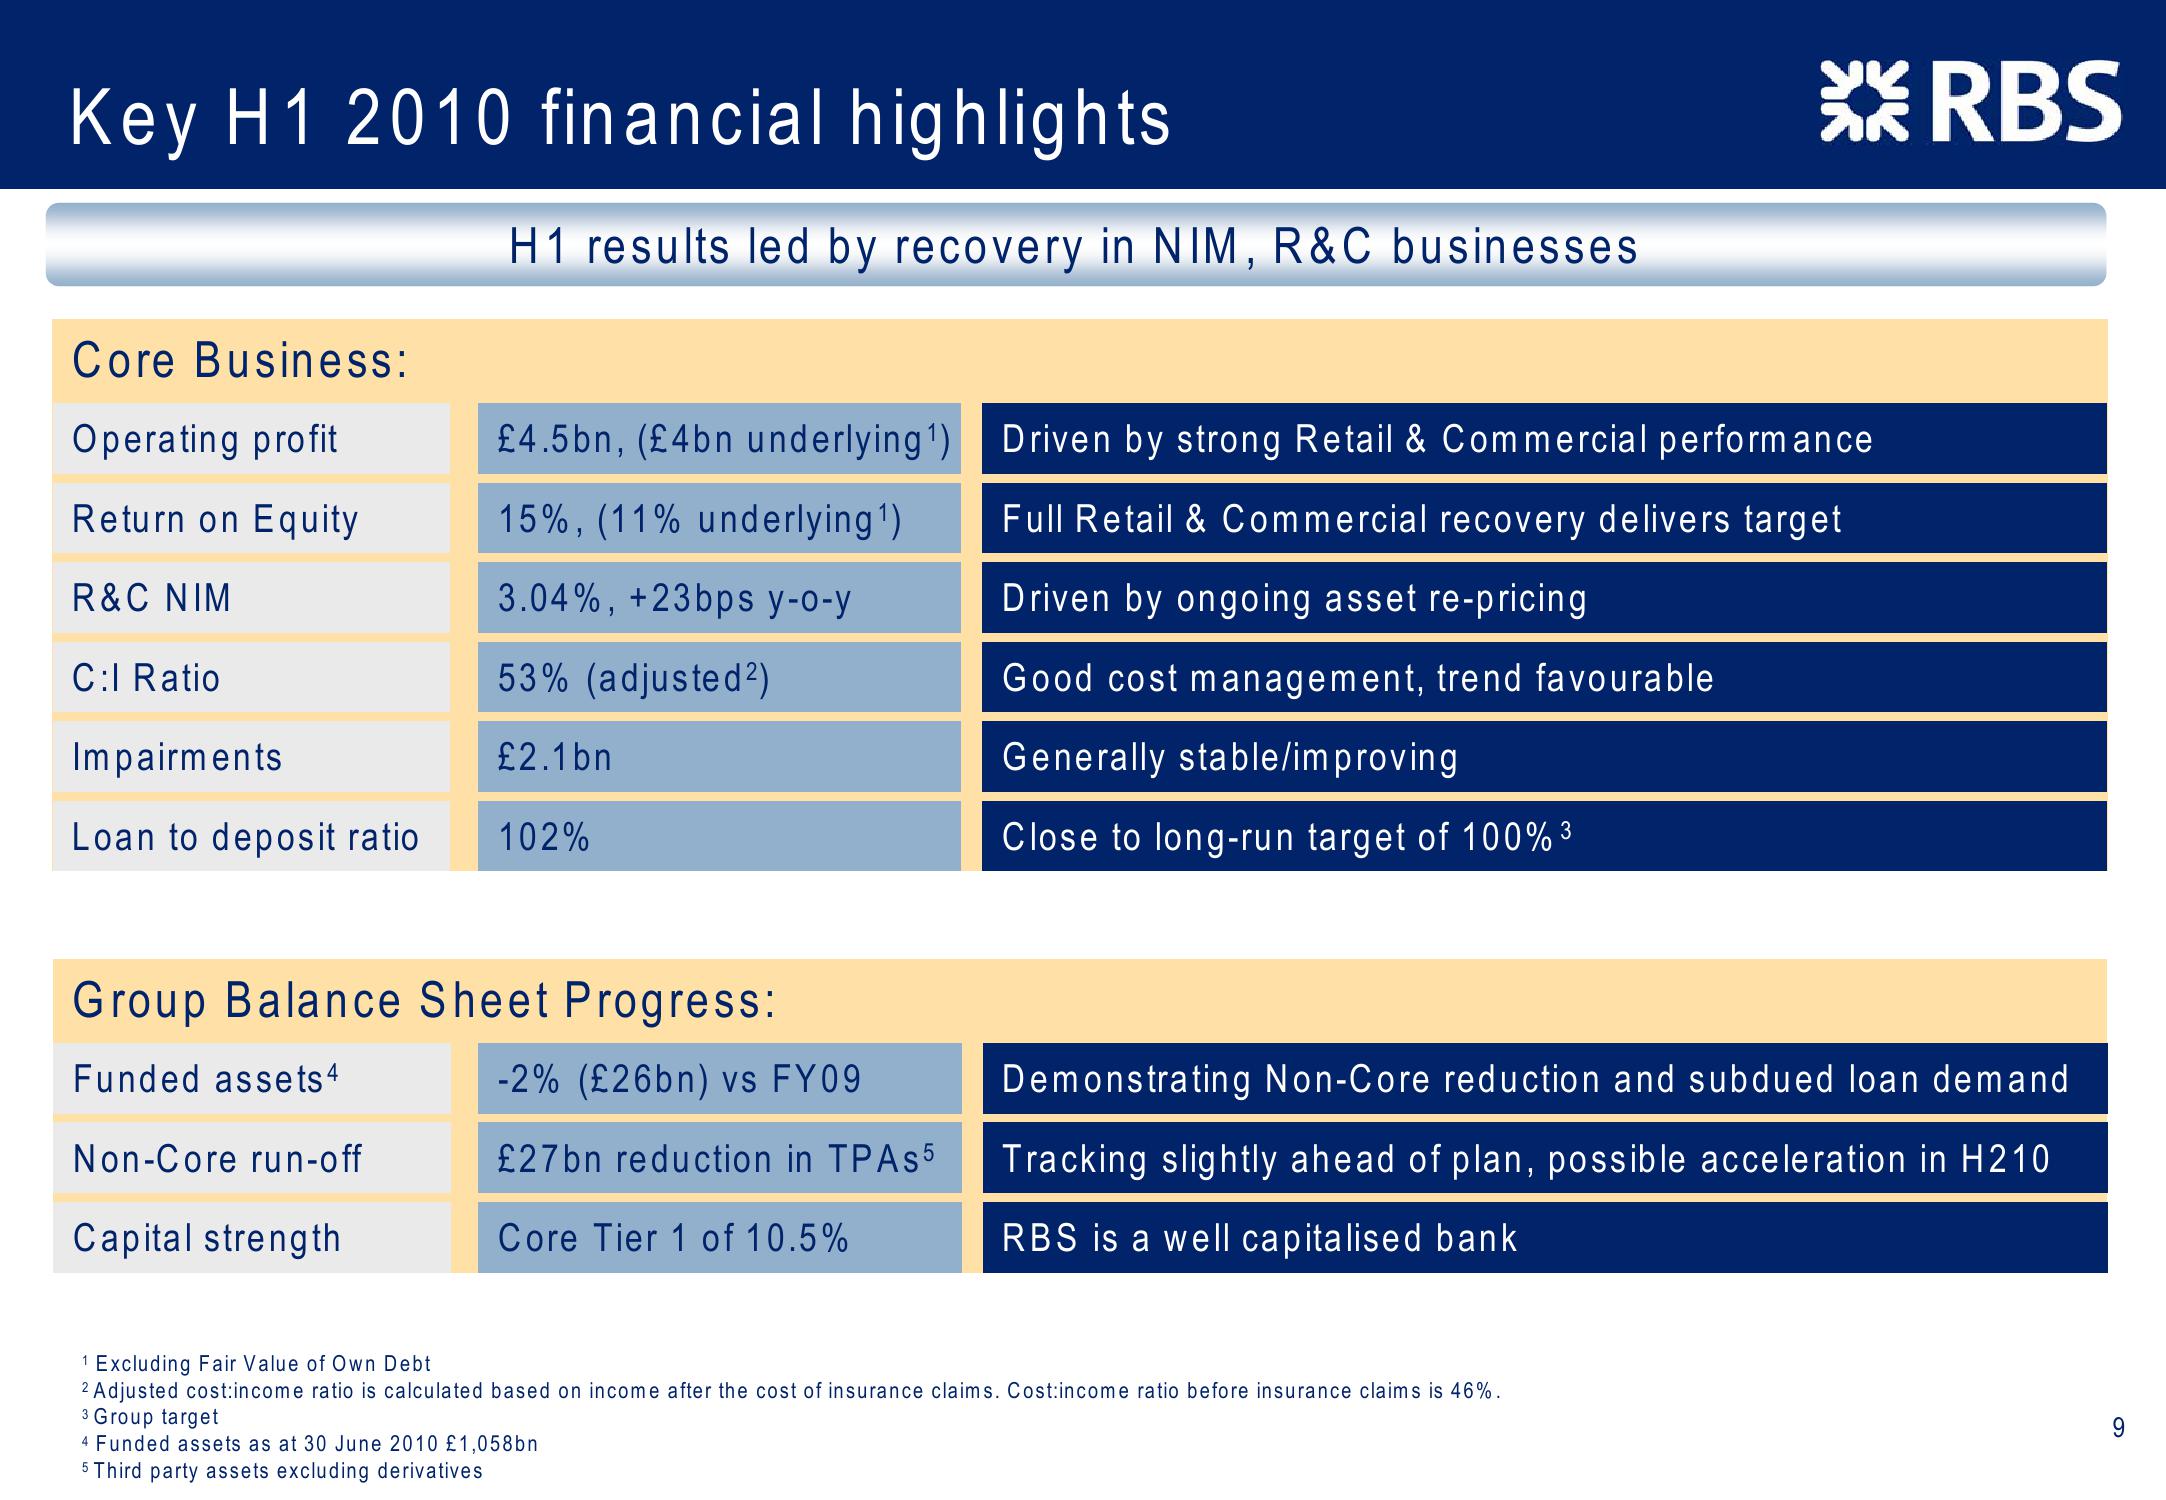
Key H1 2010 financial highlights
H1 results led by recovery in NIM, R&C businesses
XRBS
Core Business:
Operating profit
Return on Equity
R&C NIM
£4.5bn, (£4bn underlying 1)
15%, (11% underlying 1)
3.04%, +23bps y-o-y
C:l Ratio
53% (adjusted²)
Impairments
£2.1bn
Loan to deposit ratio
102%
Group Balance Sheet Progress:
Driven by strong Retail & Commercial performance
Full Retail & Commercial recovery delivers target
Driven by ongoing asset re-pricing
Good cost management, trend favourable
Funded assets 4
-2% (£26bn) vs FY09
Non-Core run-off
£27bn reduction in TPAs 5
Capital strength
Core Tier 1 of 10.5%
Generally stable/improving
3
Close to long-run target of 100% ³
Demonstrating Non-Core reduction and subdued loan demand
Tracking slightly ahead of plan, possible acceleration in H210
RBS is a well capitalised bank
1 Excluding Fair Value of Own Debt
2 Adjusted cost:income ratio is calculated based on income after the cost of insurance claims. Cost:income ratio before insurance claims is 46%.
3 Group target
4 Funded assets as at 30 June 2010 £1,058bn
5 Third party assets excluding derivatives
6View entire presentation