Innovid Investor Day Presentation Deck
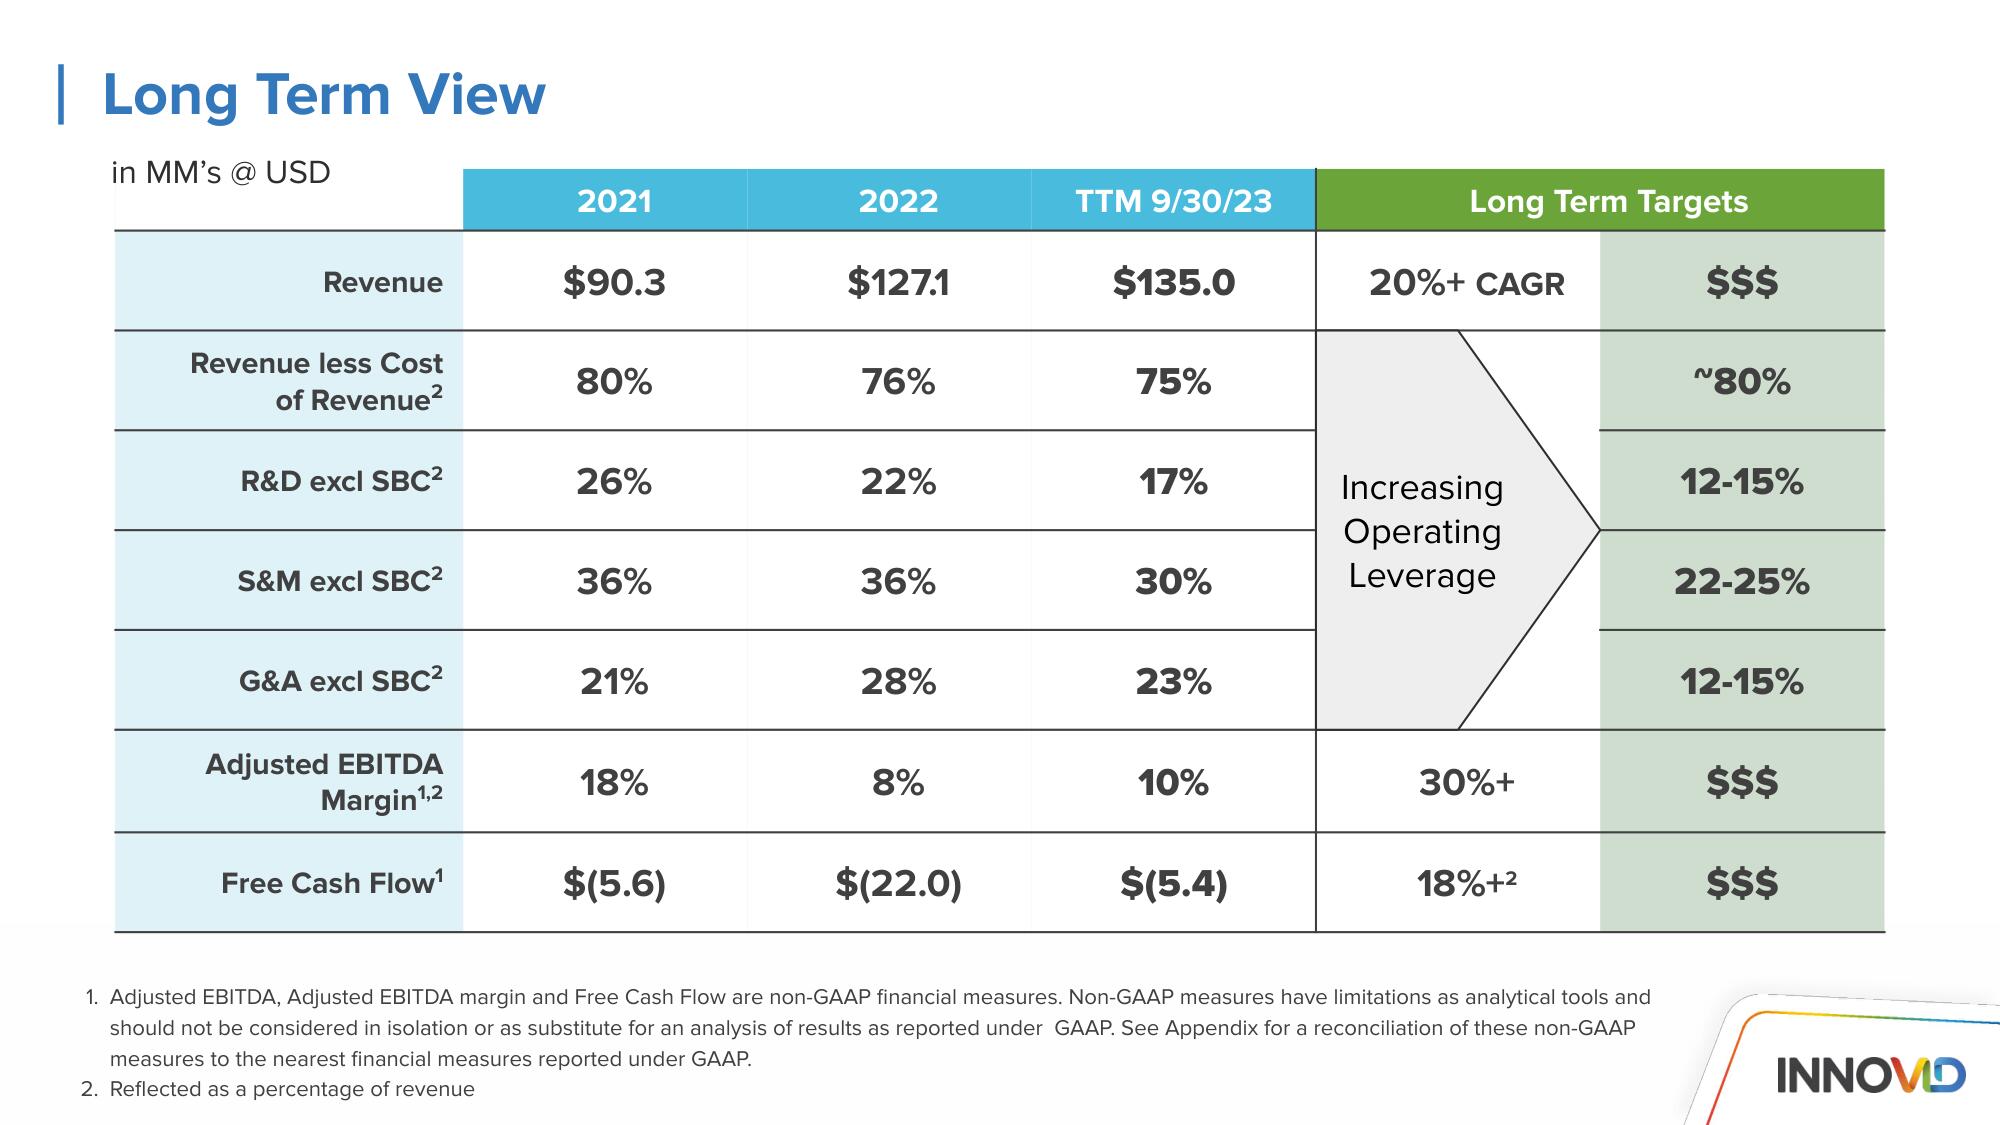
| Long Term View
in MM's @ USD
Revenue
Revenue less Cost
of Revenue²
R&D excl SBC²
S&M excl SBC²
G&A excl SBC²
Adjusted EBITDA
Margin¹,2
Free Cash Flow¹
2021
$90.3
80%
26%
36%
21%
18%
$(5.6)
2022
$127.1
76%
22%
36%
28%
8%
$(22.0)
TTM 9/30/23
$135.0
75%
17%
30%
23%
10%
$(5.4)
Long Term Targets
20%+ CAGR
Increasing
Operating
Leverage
30%+
18%+²
1. Adjusted EBITDA, Adjusted EBITDA margin and Free Cash Flow are non-GAAP financial measures. Non-GAAP measures have limitations as analytical tools and
should not be considered in isolation or as substitute for an analysis of results as reported under GAAP. See Appendix for a reconciliation of these non-GAAP
measures to the nearest financial measures reported under GAAP.
2. Reflected as a percentage of revenue
$$$
~80%
12-15%
22-25%
12-15%
$$$
$$$
INNOVDView entire presentation