3M Results Presentation Deck
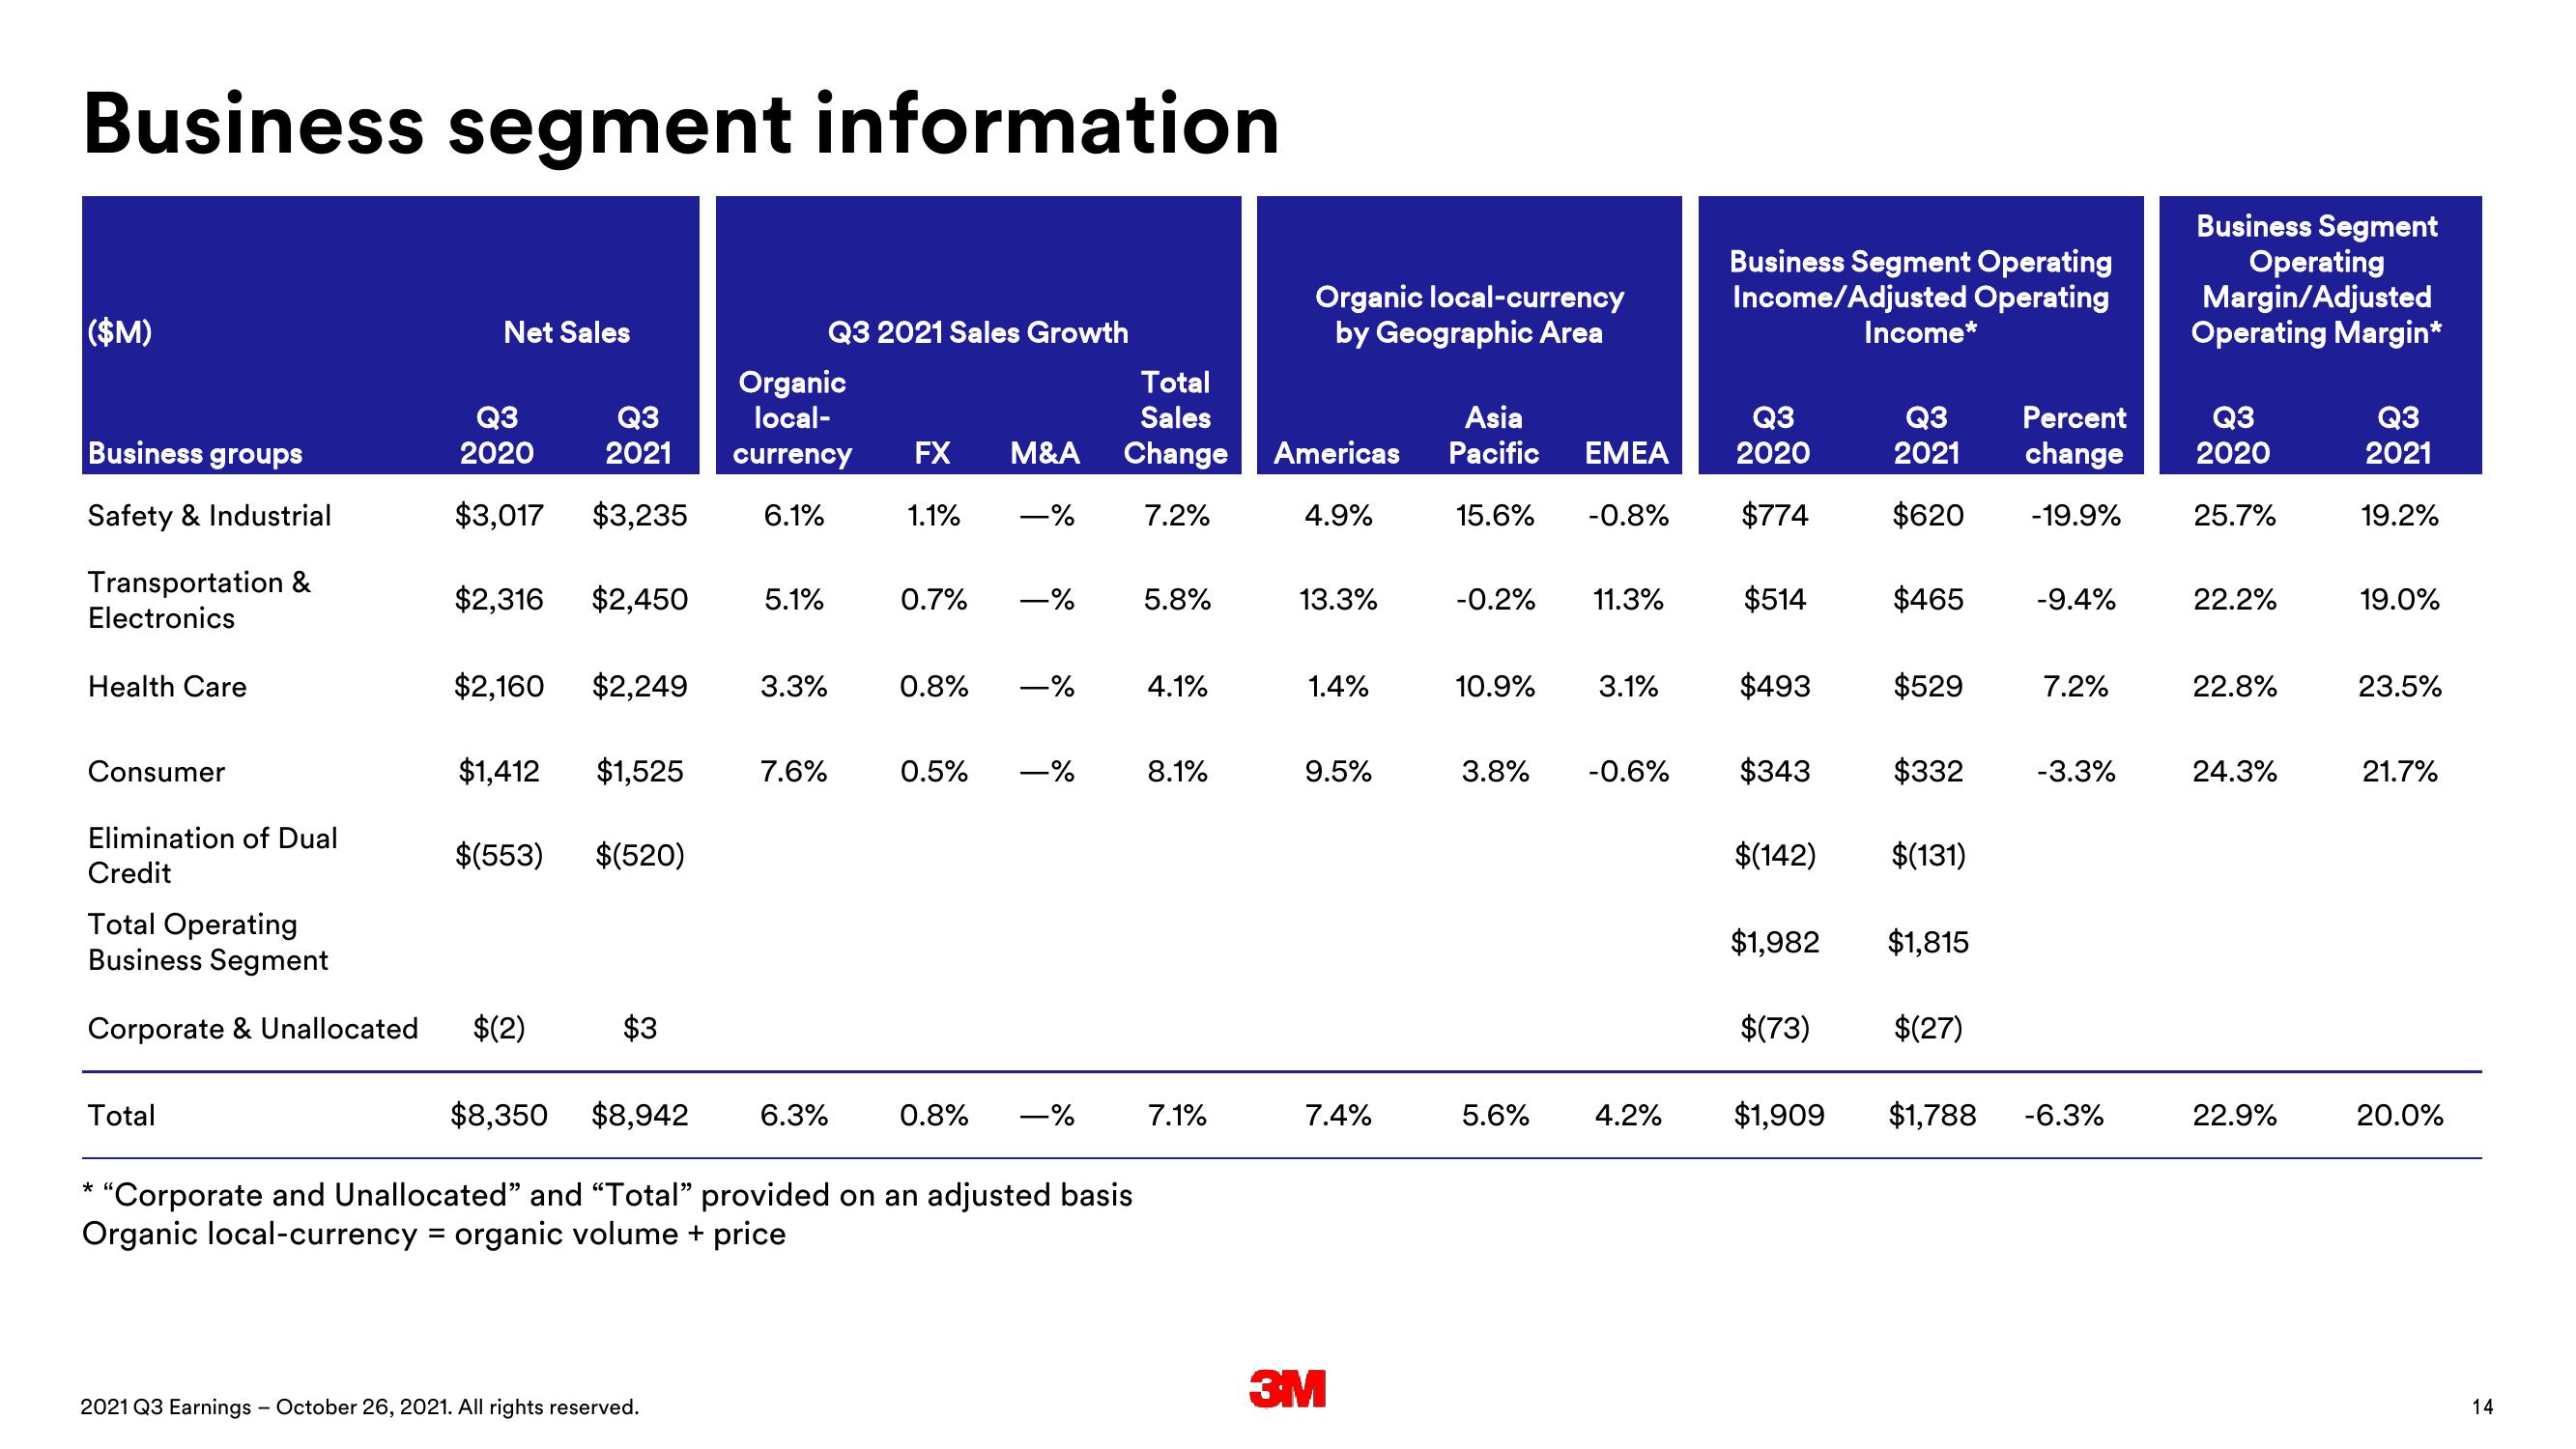
Business segment information
($M)
Business groups
Safety & Industrial
Transportation &
Electronics
Health Care
Consumer
Net Sales
Total
Q3
2020
$3,017
Q3
2021
$3,235
$2,316 $2,450 5.1%
$2,160 $2,249
Elimination of Dual
Credit
Total Operating
Business Segment
Corporate & Unallocated $(2)
$1,412 $1,525 7.6%
$(553) $(520)
$3
$8,350 $8,942
Organic
local-
currency FX M&A
6.1%
3.3%
2021 Q3 Earnings - October 26, 2021. All rights reserved.
Q3 2021 Sales Growth
6.3%
1.1%
0.7%
0.8%
-%
-%
-%
0.5% -%
0.8% -%
Total
Sales
Change
7.2%
"Corporate and Unallocated" and "Total" provided on an adjusted basis
Organic local-currency = organic volume + price
5.8%
4.1%
8.1%
7.1%
Organic local-currency
by Geographic Area
Asia
Americas Pacific
4.9%
13.3%
1.4%
9.5%
7.4%
3M
15.6% -0.8%
-0.2%
10.9%
3.8%
5.6%
Q3
EMEA 2020
$774
11.3%
3.1%
-0.6%
Business Segment Operating
Income/Adjusted Operating
4.2%
$514
$493
$343
$(142)
Income*
Q3
2021
$620
$1,909
$465
$529
$(131)
$1,982 $1,815
$(73) $(27)
Percent
change
-19.9%
$332 -3.3%
-9.4%
7.2%
$1,788 -6.3%
Business Segment
Operating
Margin/Adjusted
Operating Margin*
Q3
2020
25.7%
22.2%
22.8%
24.3%
22.9%
Q3
2021
19.2%
19.0%
23.5%
21.7%
20.0%
14View entire presentation