LandSea Homes Investor Presentation
26
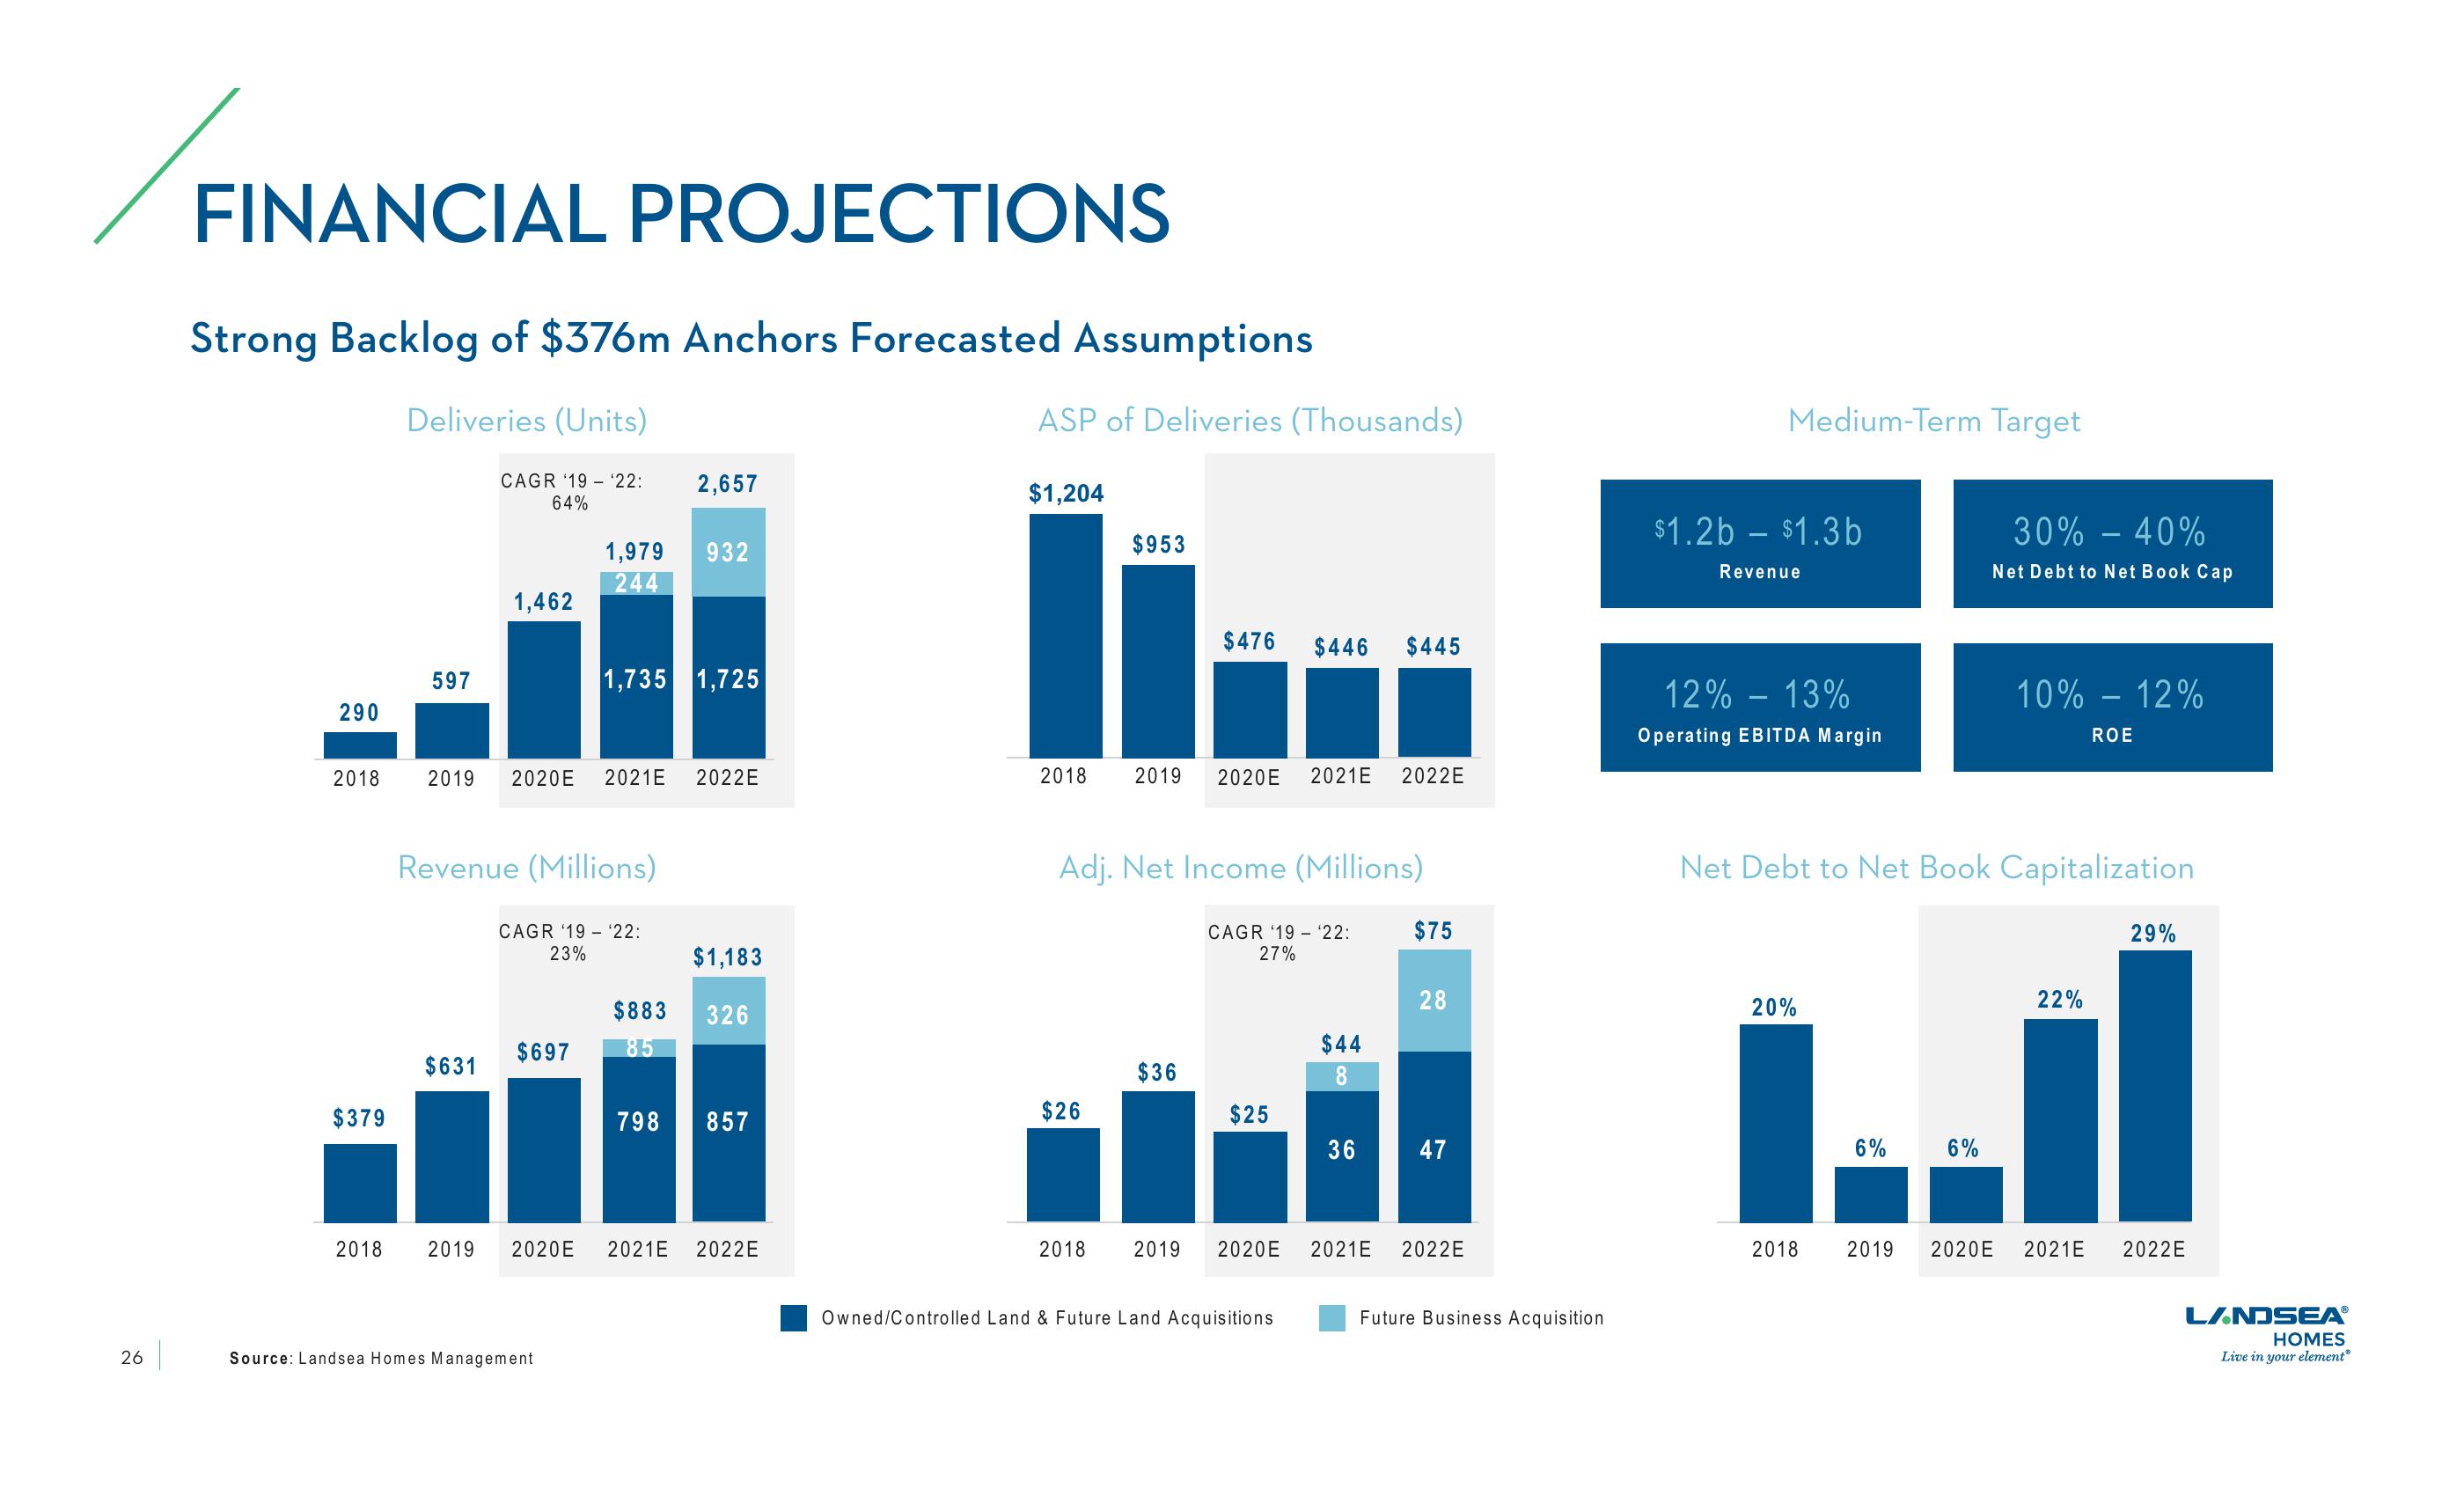
FINANCIAL PROJECTIONS
Strong Backlog of $376m Anchors Forecasted Assumptions
Deliveries (Units)
CAGR '19'22:
64%
290
2018
$379
2018
597
1,462
$631
1,979
244
Revenue (Millions)
CAGR '19 22:
23%
$697
2019 2020E 2021E 2022E
Source: Landsea Homes Management
2,657
1,735 1,725
932
$883
85
$1,183
326
798 857
2019 2020E 2021E 2022E
ASP of Deliveries (Thousands)
$1,204
2018
$953
$26
2019
$476 $446 $445
Adj. Net Income (Millions)
CAGR '19'22:
27%
$36
2020E 2021E 2022E
$25
2018 2019 2020E
Owned/Controlled Land & Future Land Acquisitions
$44
36
$75
28
47
2021E 2022E
Future Business Acquisition
Medium-Term Target
$1.2b - $1.3b
Revenue
12% - 13%
Operating EBITDA Margin
20%
Net Debt to Net Book Capitalization
2018
6%
2019
30% - 40%
Net Debt to Net Book Cap
6%
10% - 12%
ROE
22%
2020E 2021E
29%
2022E
LANDSEAⓇ
HOMES
Live in your elementⓇView entire presentation