Uber Results Presentation Deck
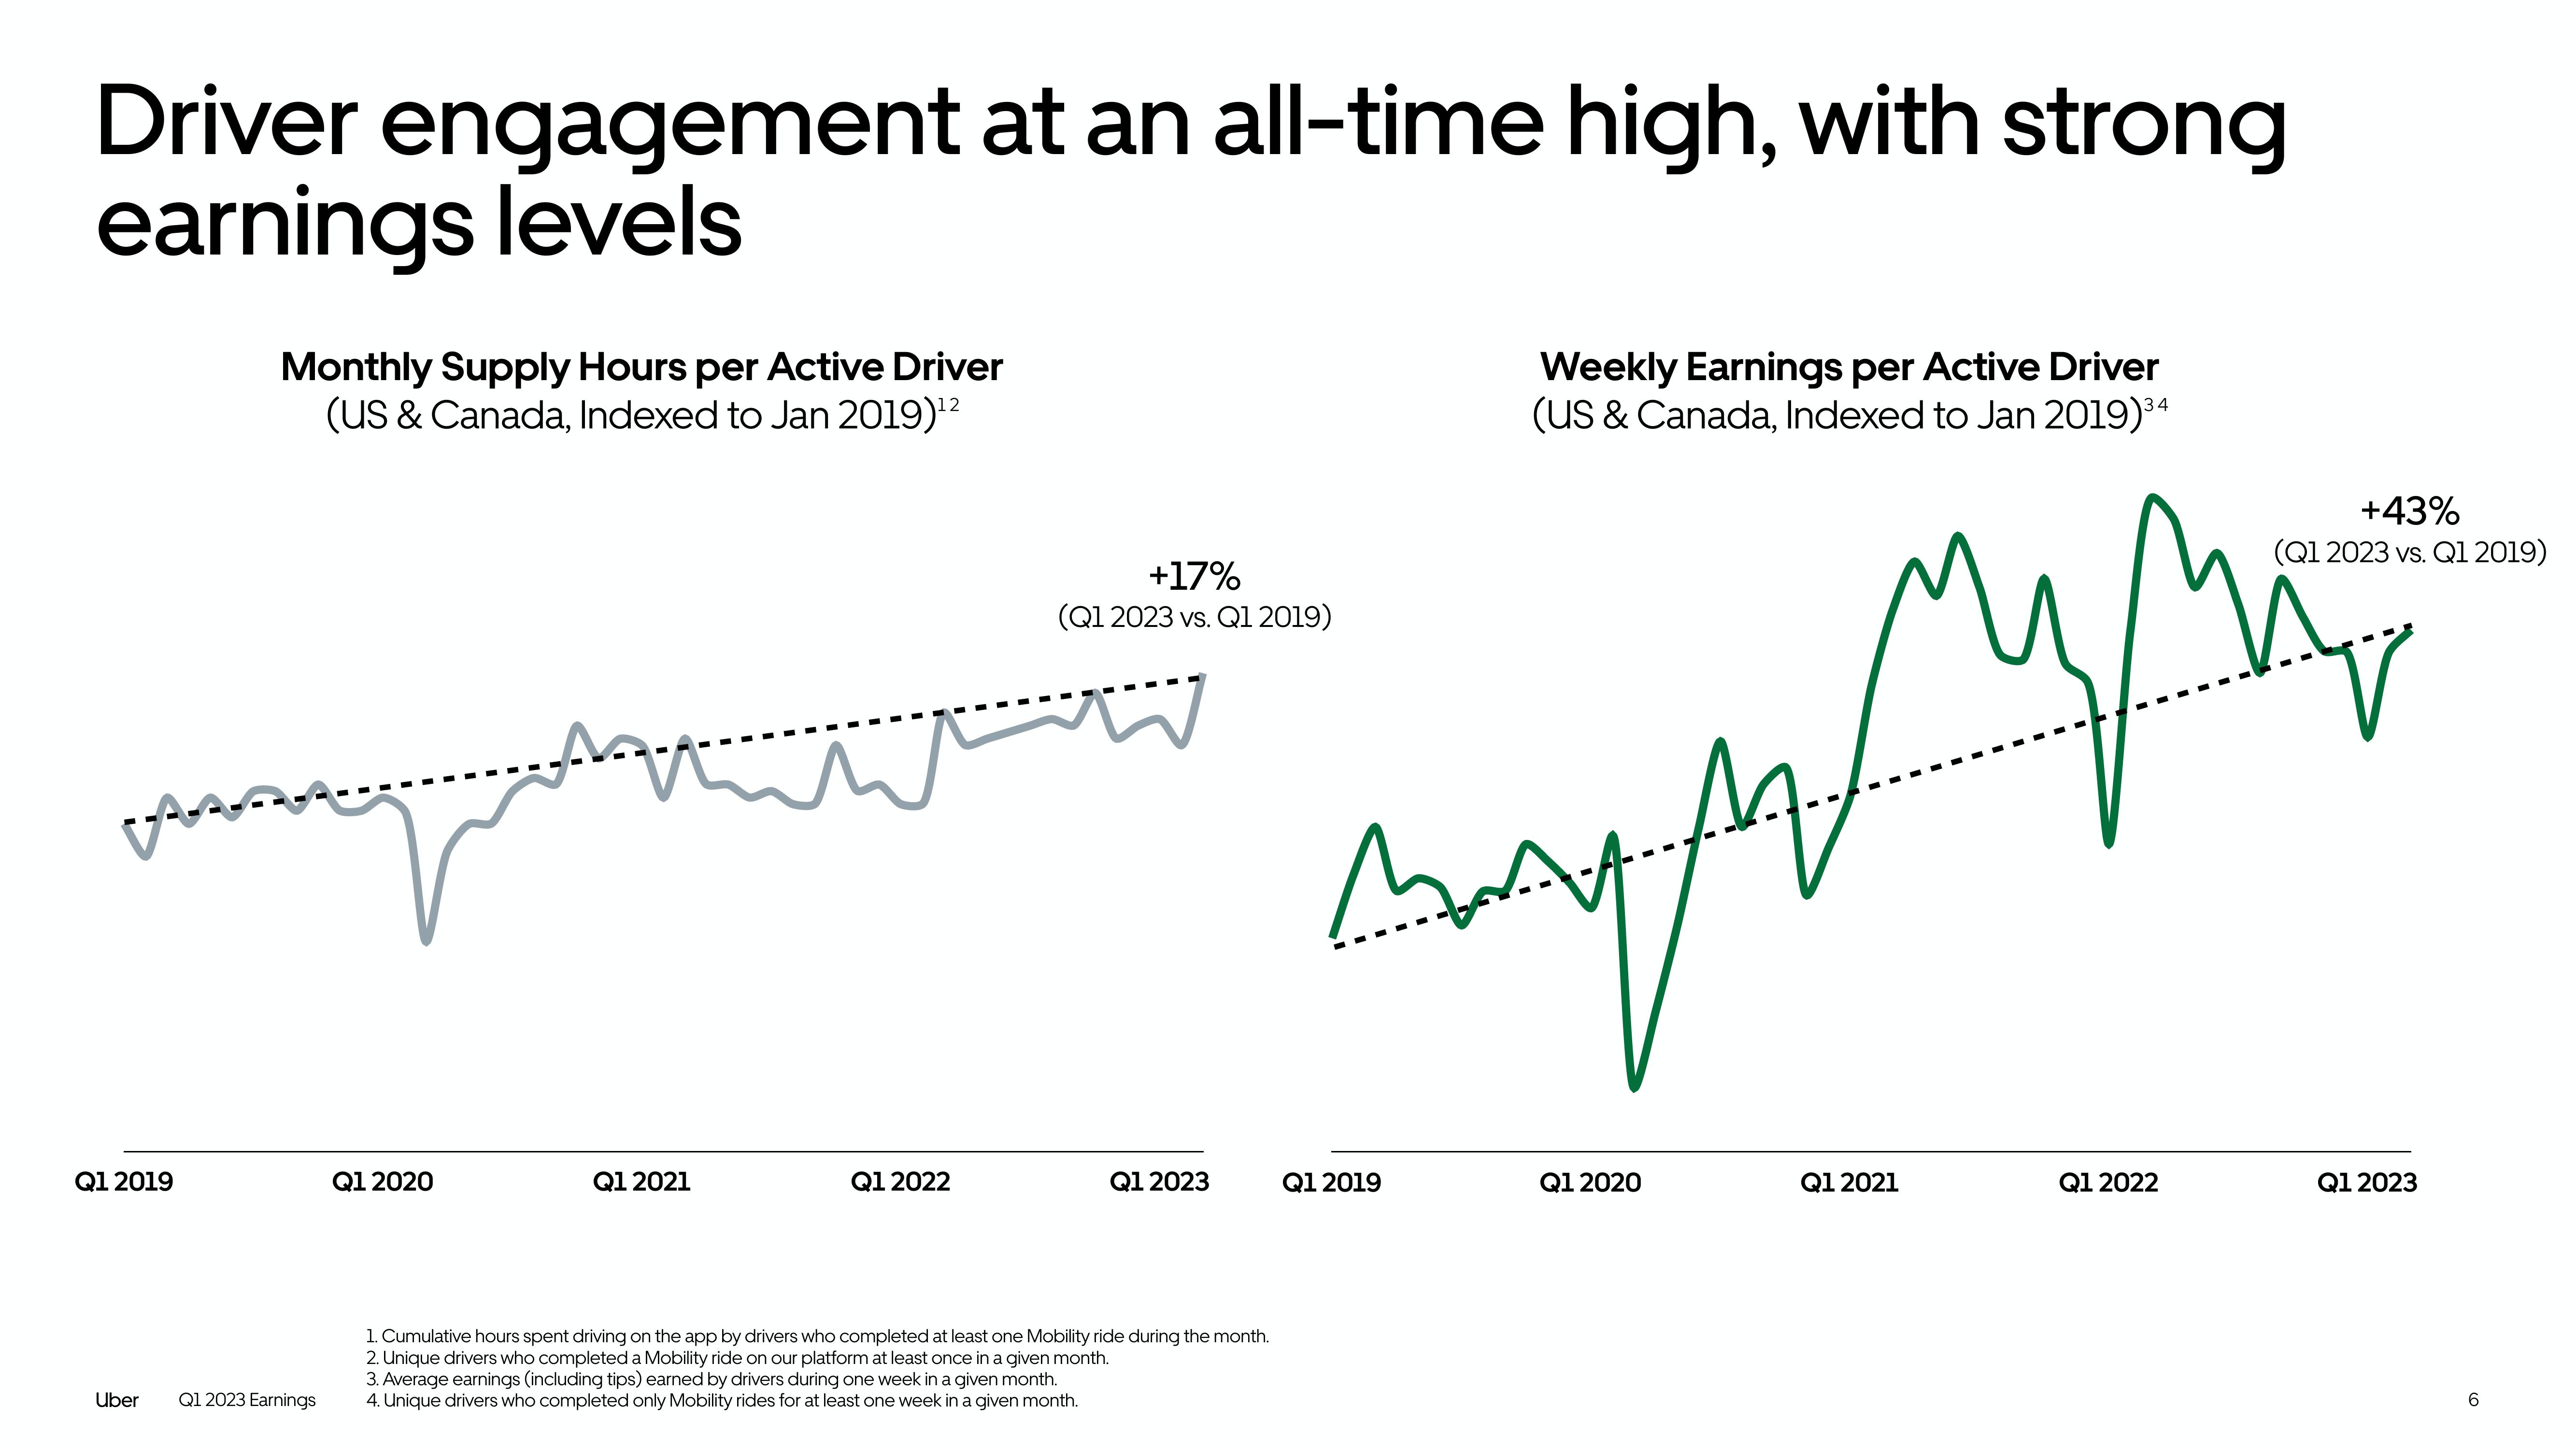
Driver engagement at an all-time high, with strong
earnings levels
Q1 2019
Uber
Monthly Supply Hours per Active Driver
(US & Canada, Indexed to Jan 2019)¹²
Q1 2023 Earnings
Q1 2020
Aq
Q1 2021
Q1 2022
Weekly Earnings per Active Driver
(US & Canada, Indexed to Jan 2019)34
My
mangf
+17%
(Q1 2023 vs. Q1 2019)
Q1 2023
1. Cumulative hours spent driving on the app by drivers who completed at least one Mobility ride during the month.
2. Unique drivers who completed a Mobility ride on our platform at least once in a given month.
3. Average earnings (including tips) earned by drivers during one week in a given month.
4. Unique drivers who completed only Mobility rides for at least one week in a given month.
Q1 2019
Q1 2020
Q1 2021
Q1 2022
+43%
(Q1 2023 vs. Q1 2019)
Ÿ
Q1 2023
6View entire presentation