SmileDirectClub Investor Presentation Deck
Balance sheet highlights.
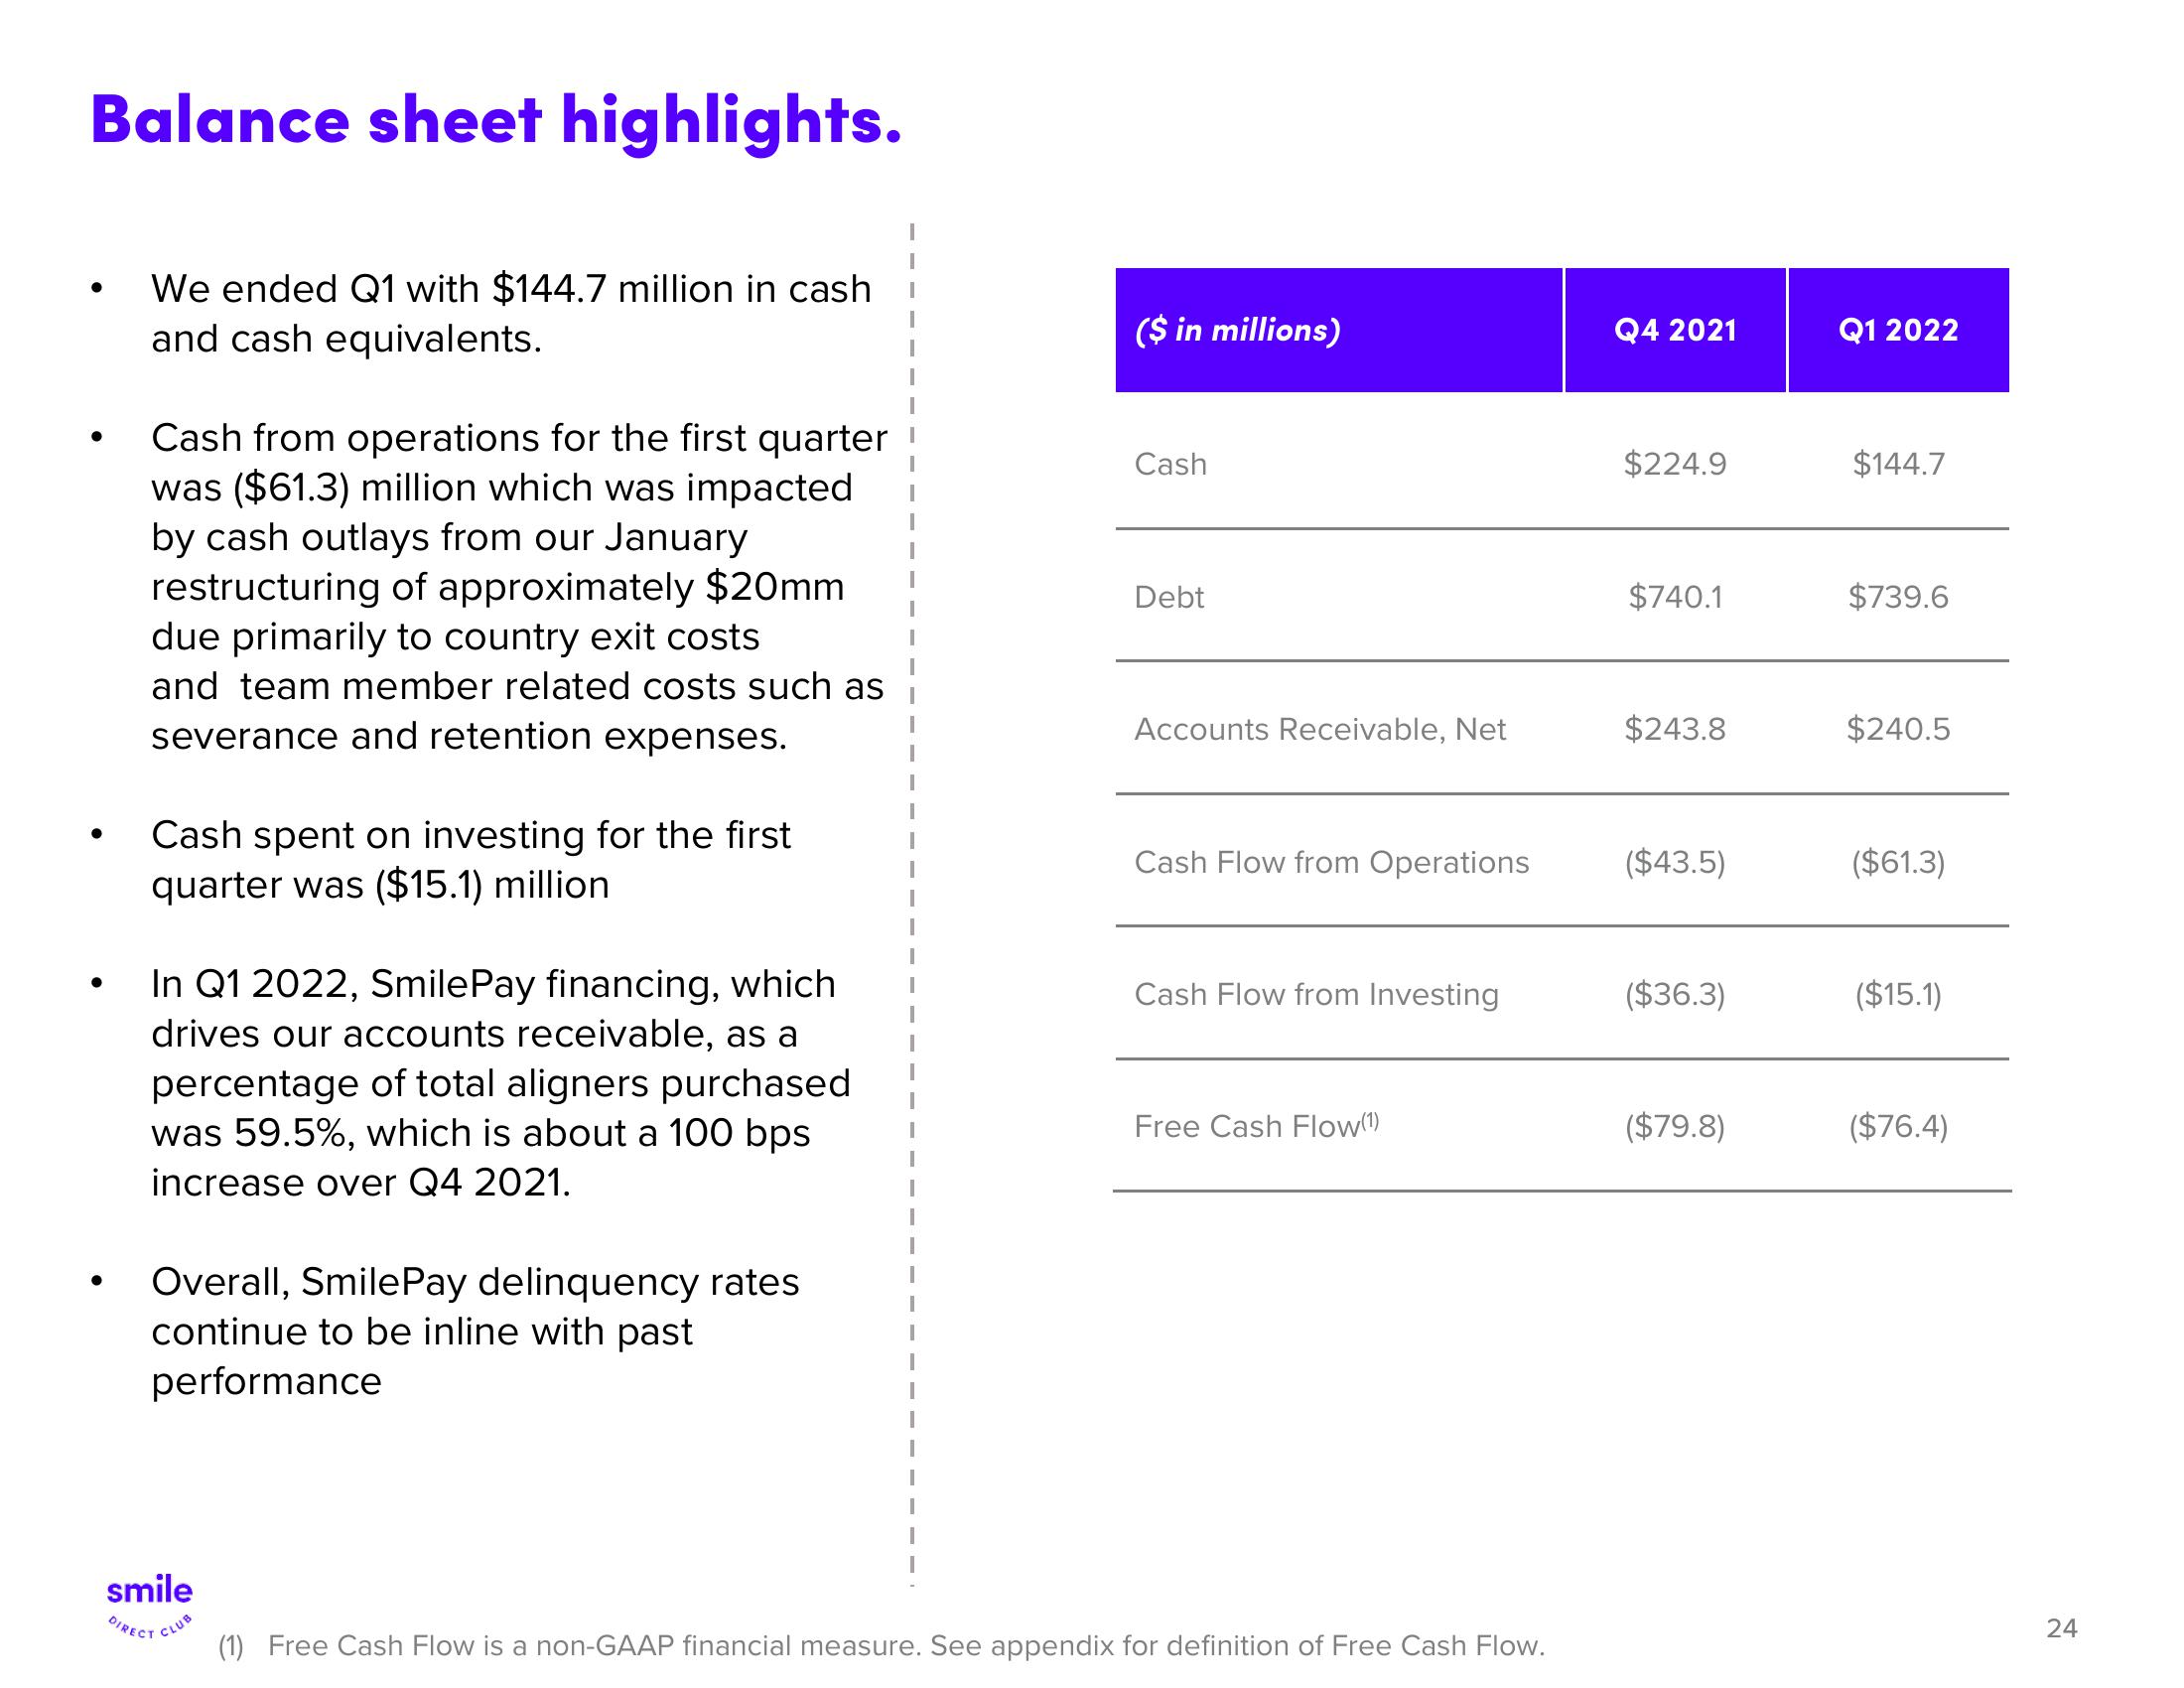
We ended Q1 with $144.7 million in cash
and cash equivalents.
●
Cash from operations for the first quarter
was ($61.3) million which was impacted
by cash outlays from our January
restructuring of approximately $20mm
due primarily to country exit costs
and team member related costs such as
severance and retention expenses.
Cash spent on investing for the first
quarter was ($15.1) million
In Q1 2022, SmilePay financing, which
drives our accounts receivable, as a
percentage of total aligners purchased
was 59.5%, which is about a 100 bps
increase over Q4 2021.
Overall, SmilePay delinquency rates
continue to be inline with past
performance
smile
DIRECT
CLUB
($ in millions)
Cash
Debt
Accounts Receivable, Net
Cash Flow from Operations
Cash Flow from Investing
Free Cash Flow(¹)
(1) Free Cash Flow is a non-GAAP financial measure. See appendix for definition of Free Cash Flow.
Q4 2021
$224.9
$740.1
$243.8
($43.5)
($36.3)
($79.8)
Q1 2022
$144.7
$739.6
$240.5
($61.3)
($15.1)
($76.4)
24View entire presentation