Zoominfo Results Presentation Deck
Q1 EARNINGS CALL > NON-GAAP FINANCIAL MEASURES
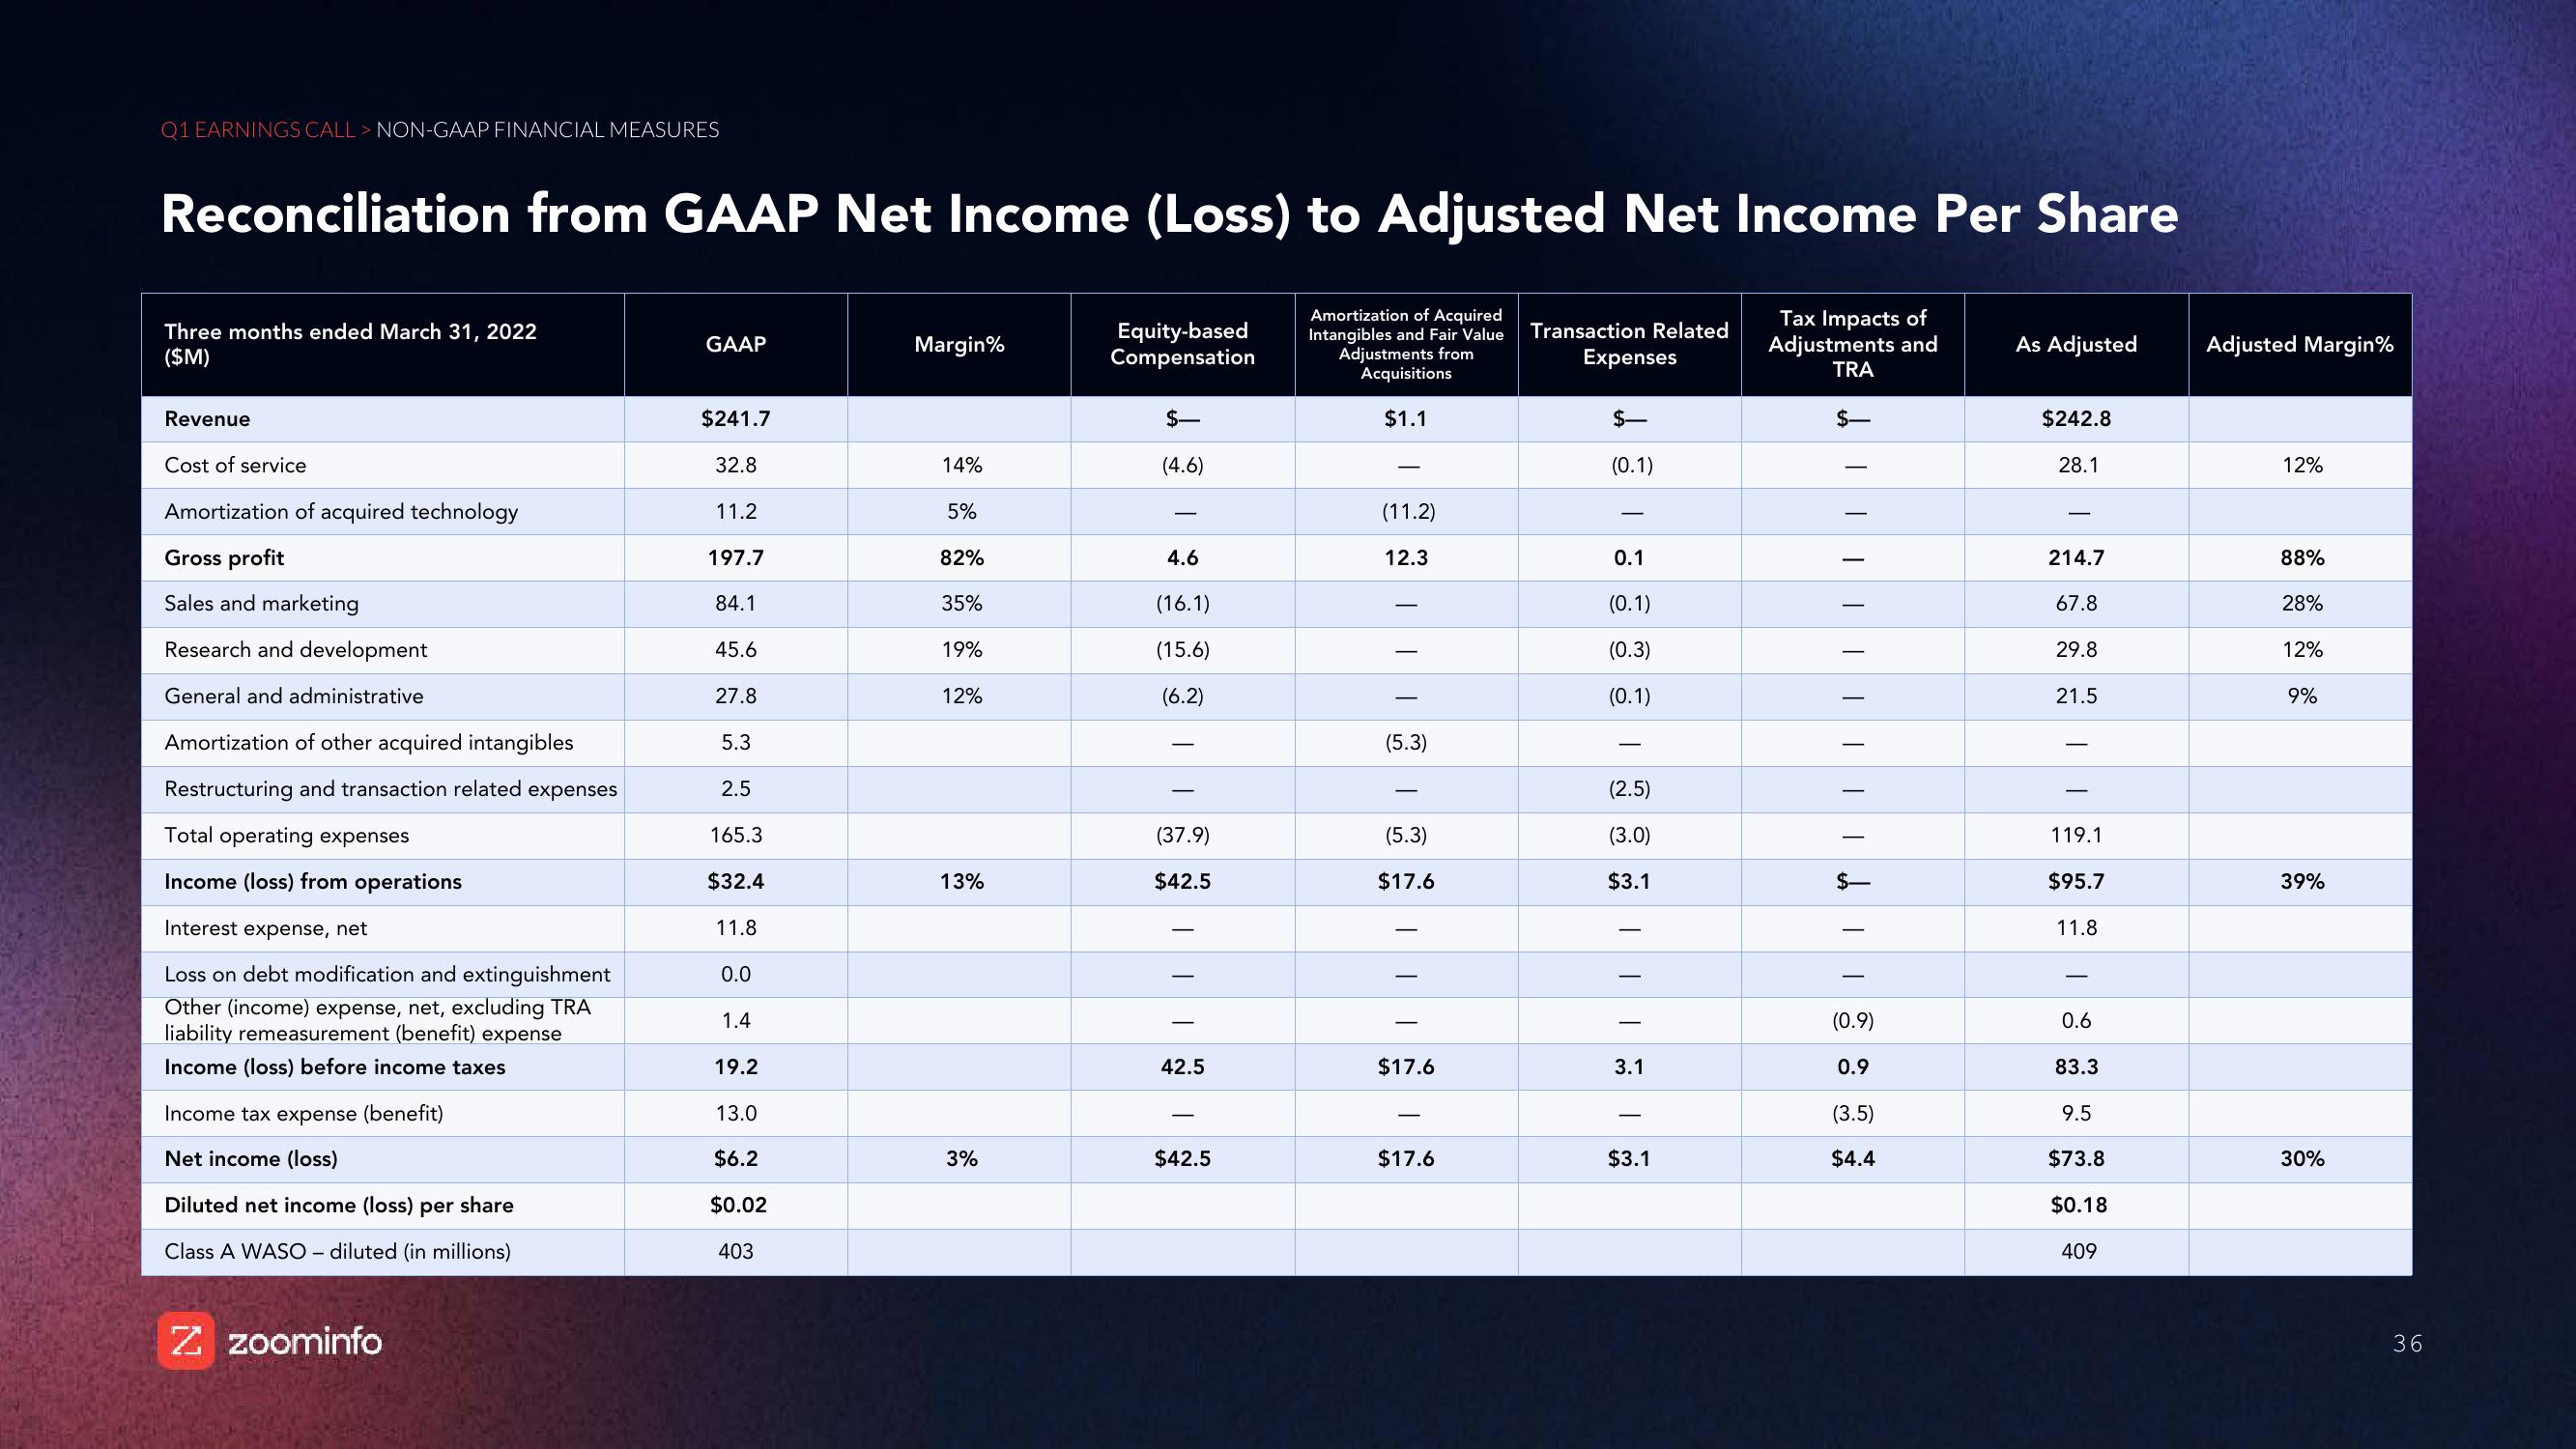
Reconciliation from GAAP Net Income (Loss) to Adjusted Net Income Per Share
Three months ended March 31, 2022
($M)
Revenue
Cost of service
Amortization of acquired technology
Gross profit
Sales and marketing
Research and development
General and administrative
Amortization of other acquired intangibles
Restructuring and transaction related expenses
Total operating expenses
Income (loss) from operations
Interest expense, net
Loss on debt modification and extinguishment
Other (income) expense, net, excluding TRA
liability remeasurement (benefit) expense
Income (loss) before income taxes
Income tax expense (benefit)
Net income (loss)
Diluted net income (loss) per share
Class A WASO- diluted (in millions)
Z zoominfo
GAAP
$241.7
32.8
11.2
197.7
84.1
45.6
27.8
5.3
2.5
165.3
$32.4
11.8
0.0
1.4
19.2
13.0
$6.2
$0.02
403
Margin%
14%
5%
82%
35%
19%
12%
13%
3%
Equity-based
Compensation
$-
(4.6)
4.6
(16.1)
(15.6)
(6.2)
(37.9)
$42.5
42.5
$42.5
Amortization of Acquired
Intangibles and Fair Value
Adjustments from
Acquisitions
$1.1
(11.2)
12.3
(5.3)
(5.3)
$17.6
I
T
$17.6
$17.6
Transaction Related
Expenses
$-
(0.1)
0.1
(0.1)
(0.3)
(0.1)
(2.5)
(3.0)
$3.1
3.1
$3.1
Tax Impacts of
Adjustments and
TRA
|||||||||
$-
(0.9)
0.9
(3.5)
$4.4
As Adjusted
$242.8
28.1
214.7
67.8
29.8
21.5
119.1
$95.7
11.8
0.6
83.3
9.5
$73.8
$0.18
409
Adjusted Margin%
12%
88%
28%
12%
9%
39%
30%
36View entire presentation