Cadre Holdings IPO Presentation Deck
ADJ. EBITDA AND FREE CASH FLOW GENERATION
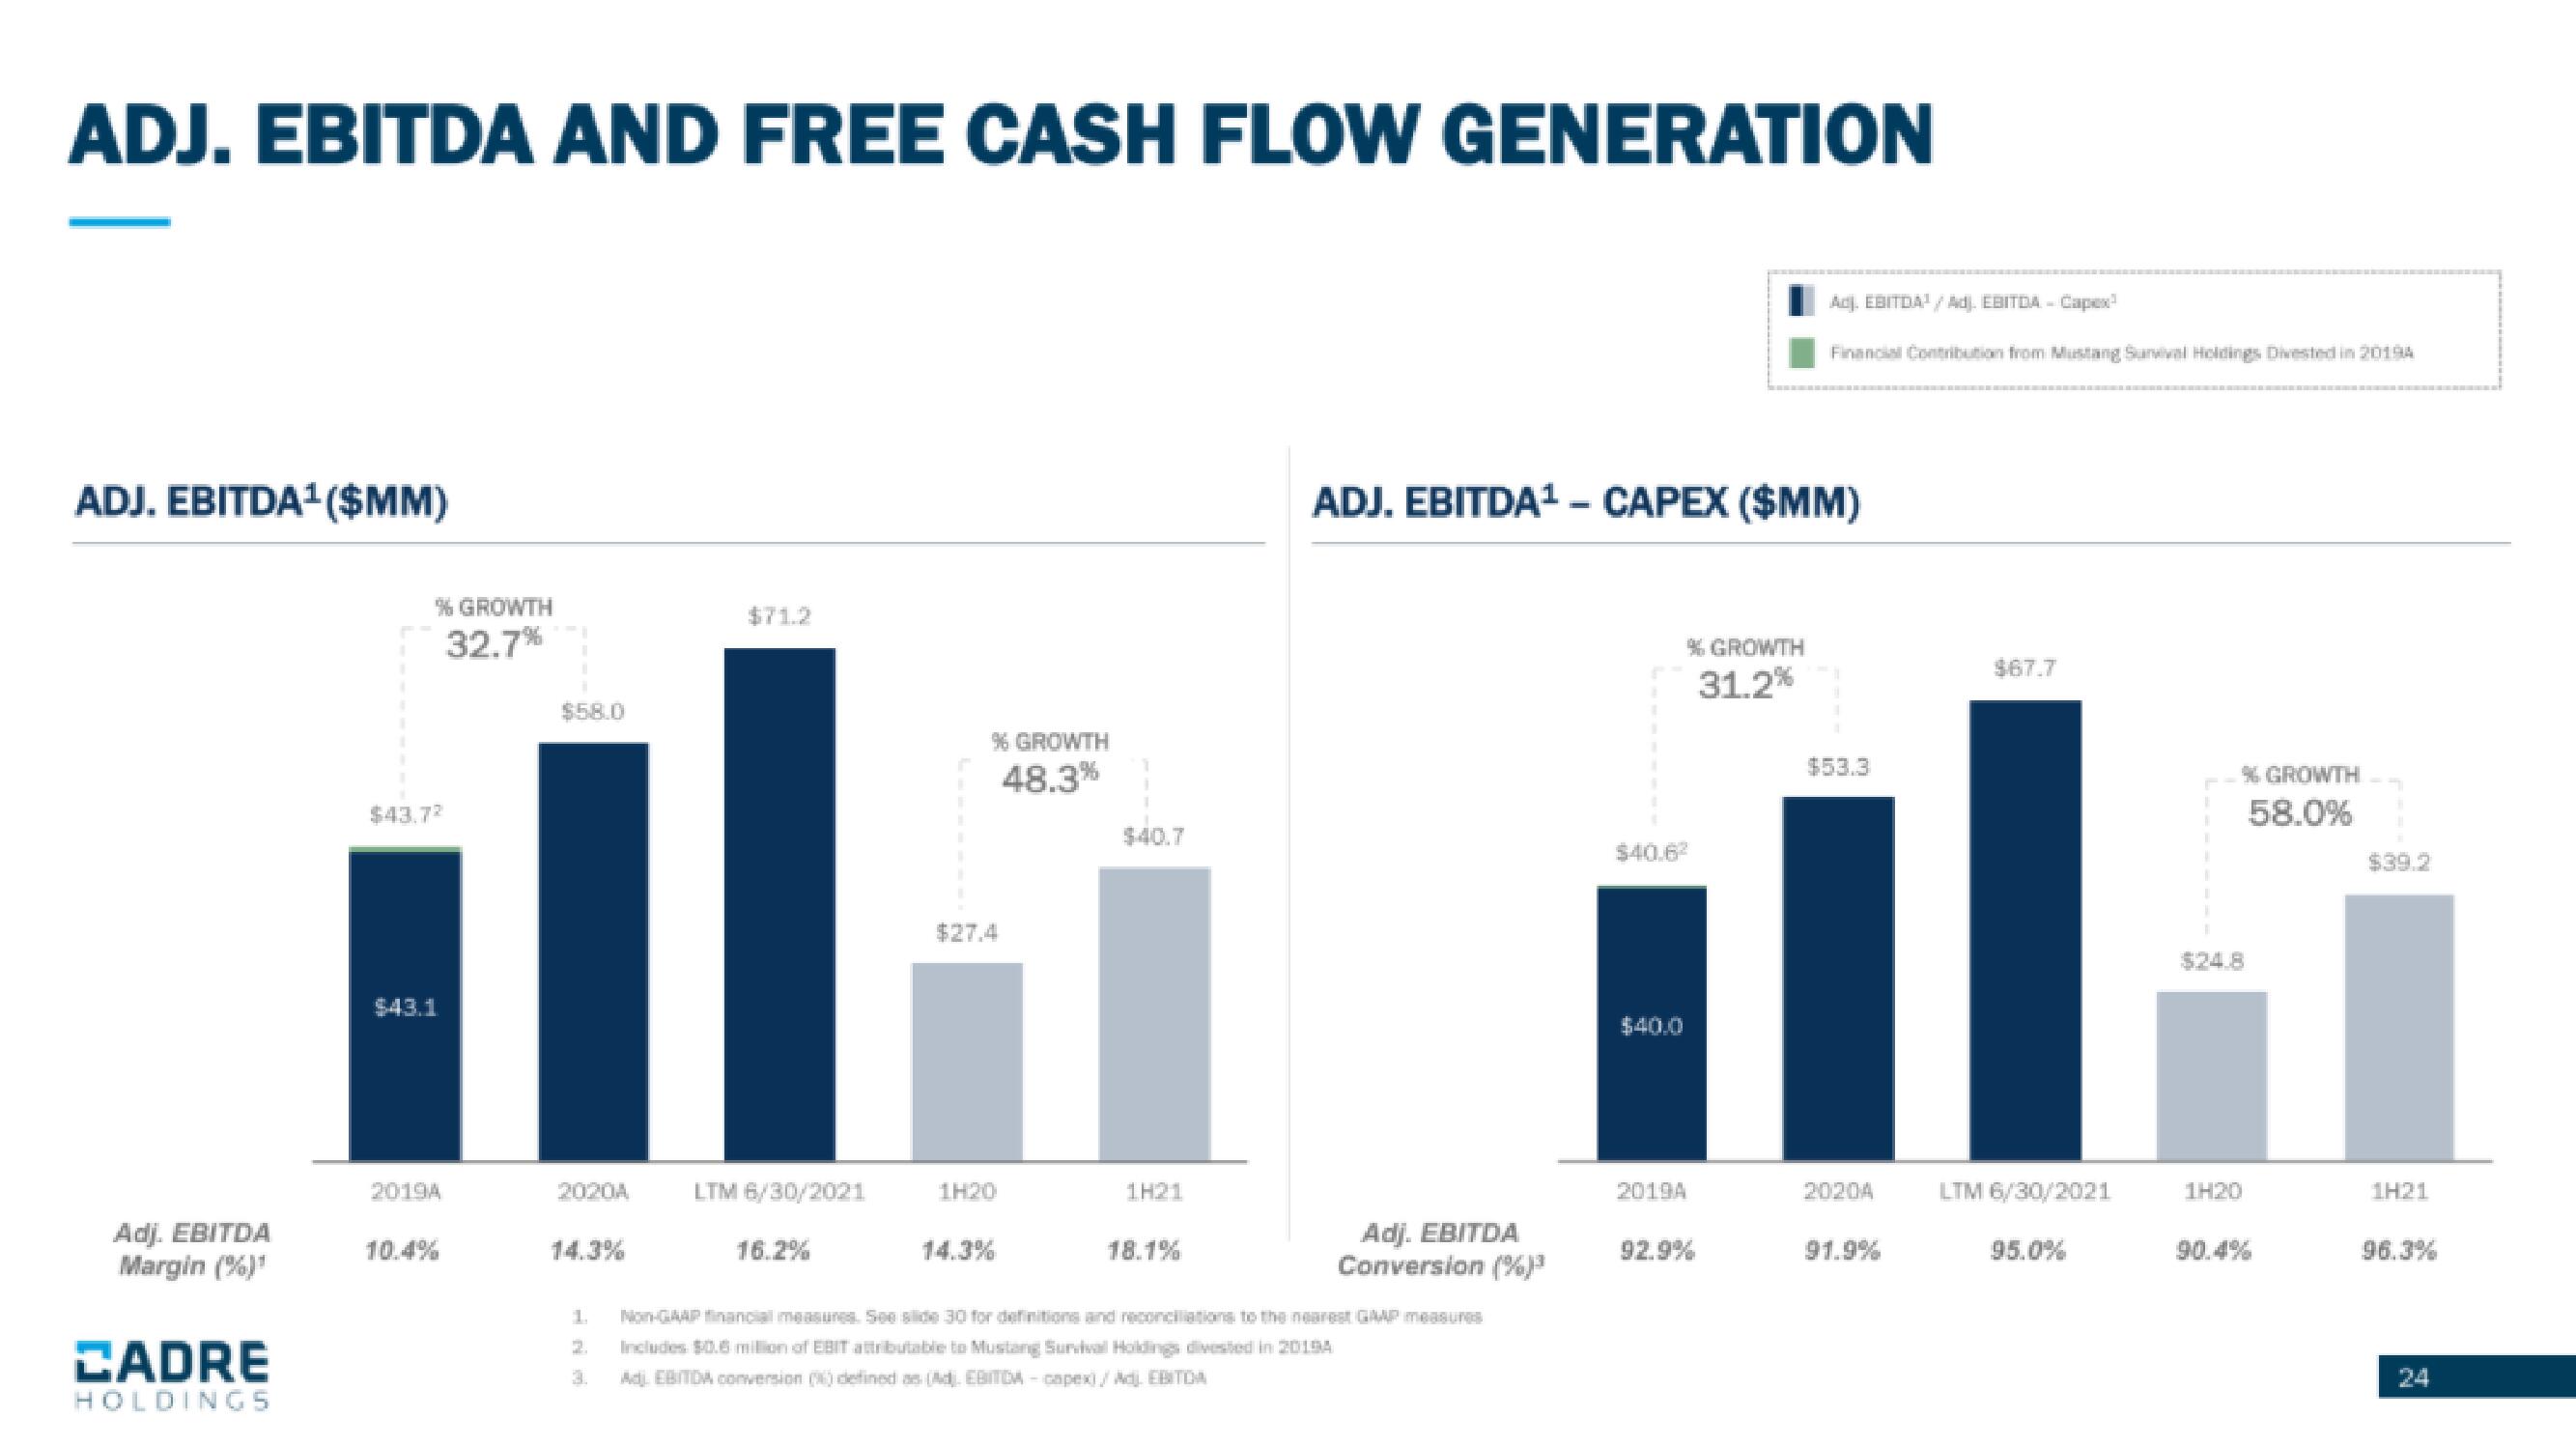
ADJ. EBITDA¹($MM)
Adj. EBITDA
Margin (%)*
CADRE
HOLDINGS
% GROWTH
32.7%
$43.72
$43.1
2019A
10.4%
$58.0
2020A
LTM 6/30/2021
16.2%
% GROWTH
48.3%
$27.4
1H20
$40.7
1H21
18.1%
ADJ. EBITDA¹ - CAPEX ($MM)
Adj. EBITDA
Conversion (%) ³
1. Non-GAAP financial measures. See siide 30 for definitions and reconciliations to the nearest GAAP measung
Includes $0.6 milion of EBIT attributable to Mustang Survival Holdings divested in 20194
2.
3.
Adj. EBITDA conversion (9) defined as (Ad). EBITDA - Gapex) / Adj. EBITDA
% GROWTH
31.2%
$40.6²
$40.0
Adj. EBITDA¹/Adj. EBITDA - Capex
Financial Contribution from Mustang Survéval Holdings Divested in 20194
2019A
$53.3
20204
91.9%
$67.7
LTM 6/30/2021
95.0%
1H20
% GROWTH
58.0%
90.4%
$39.2
1H21
96.3%View entire presentation