Enact IPO Presentation Deck
Enact | Investor Presentation
Financial Snapshot
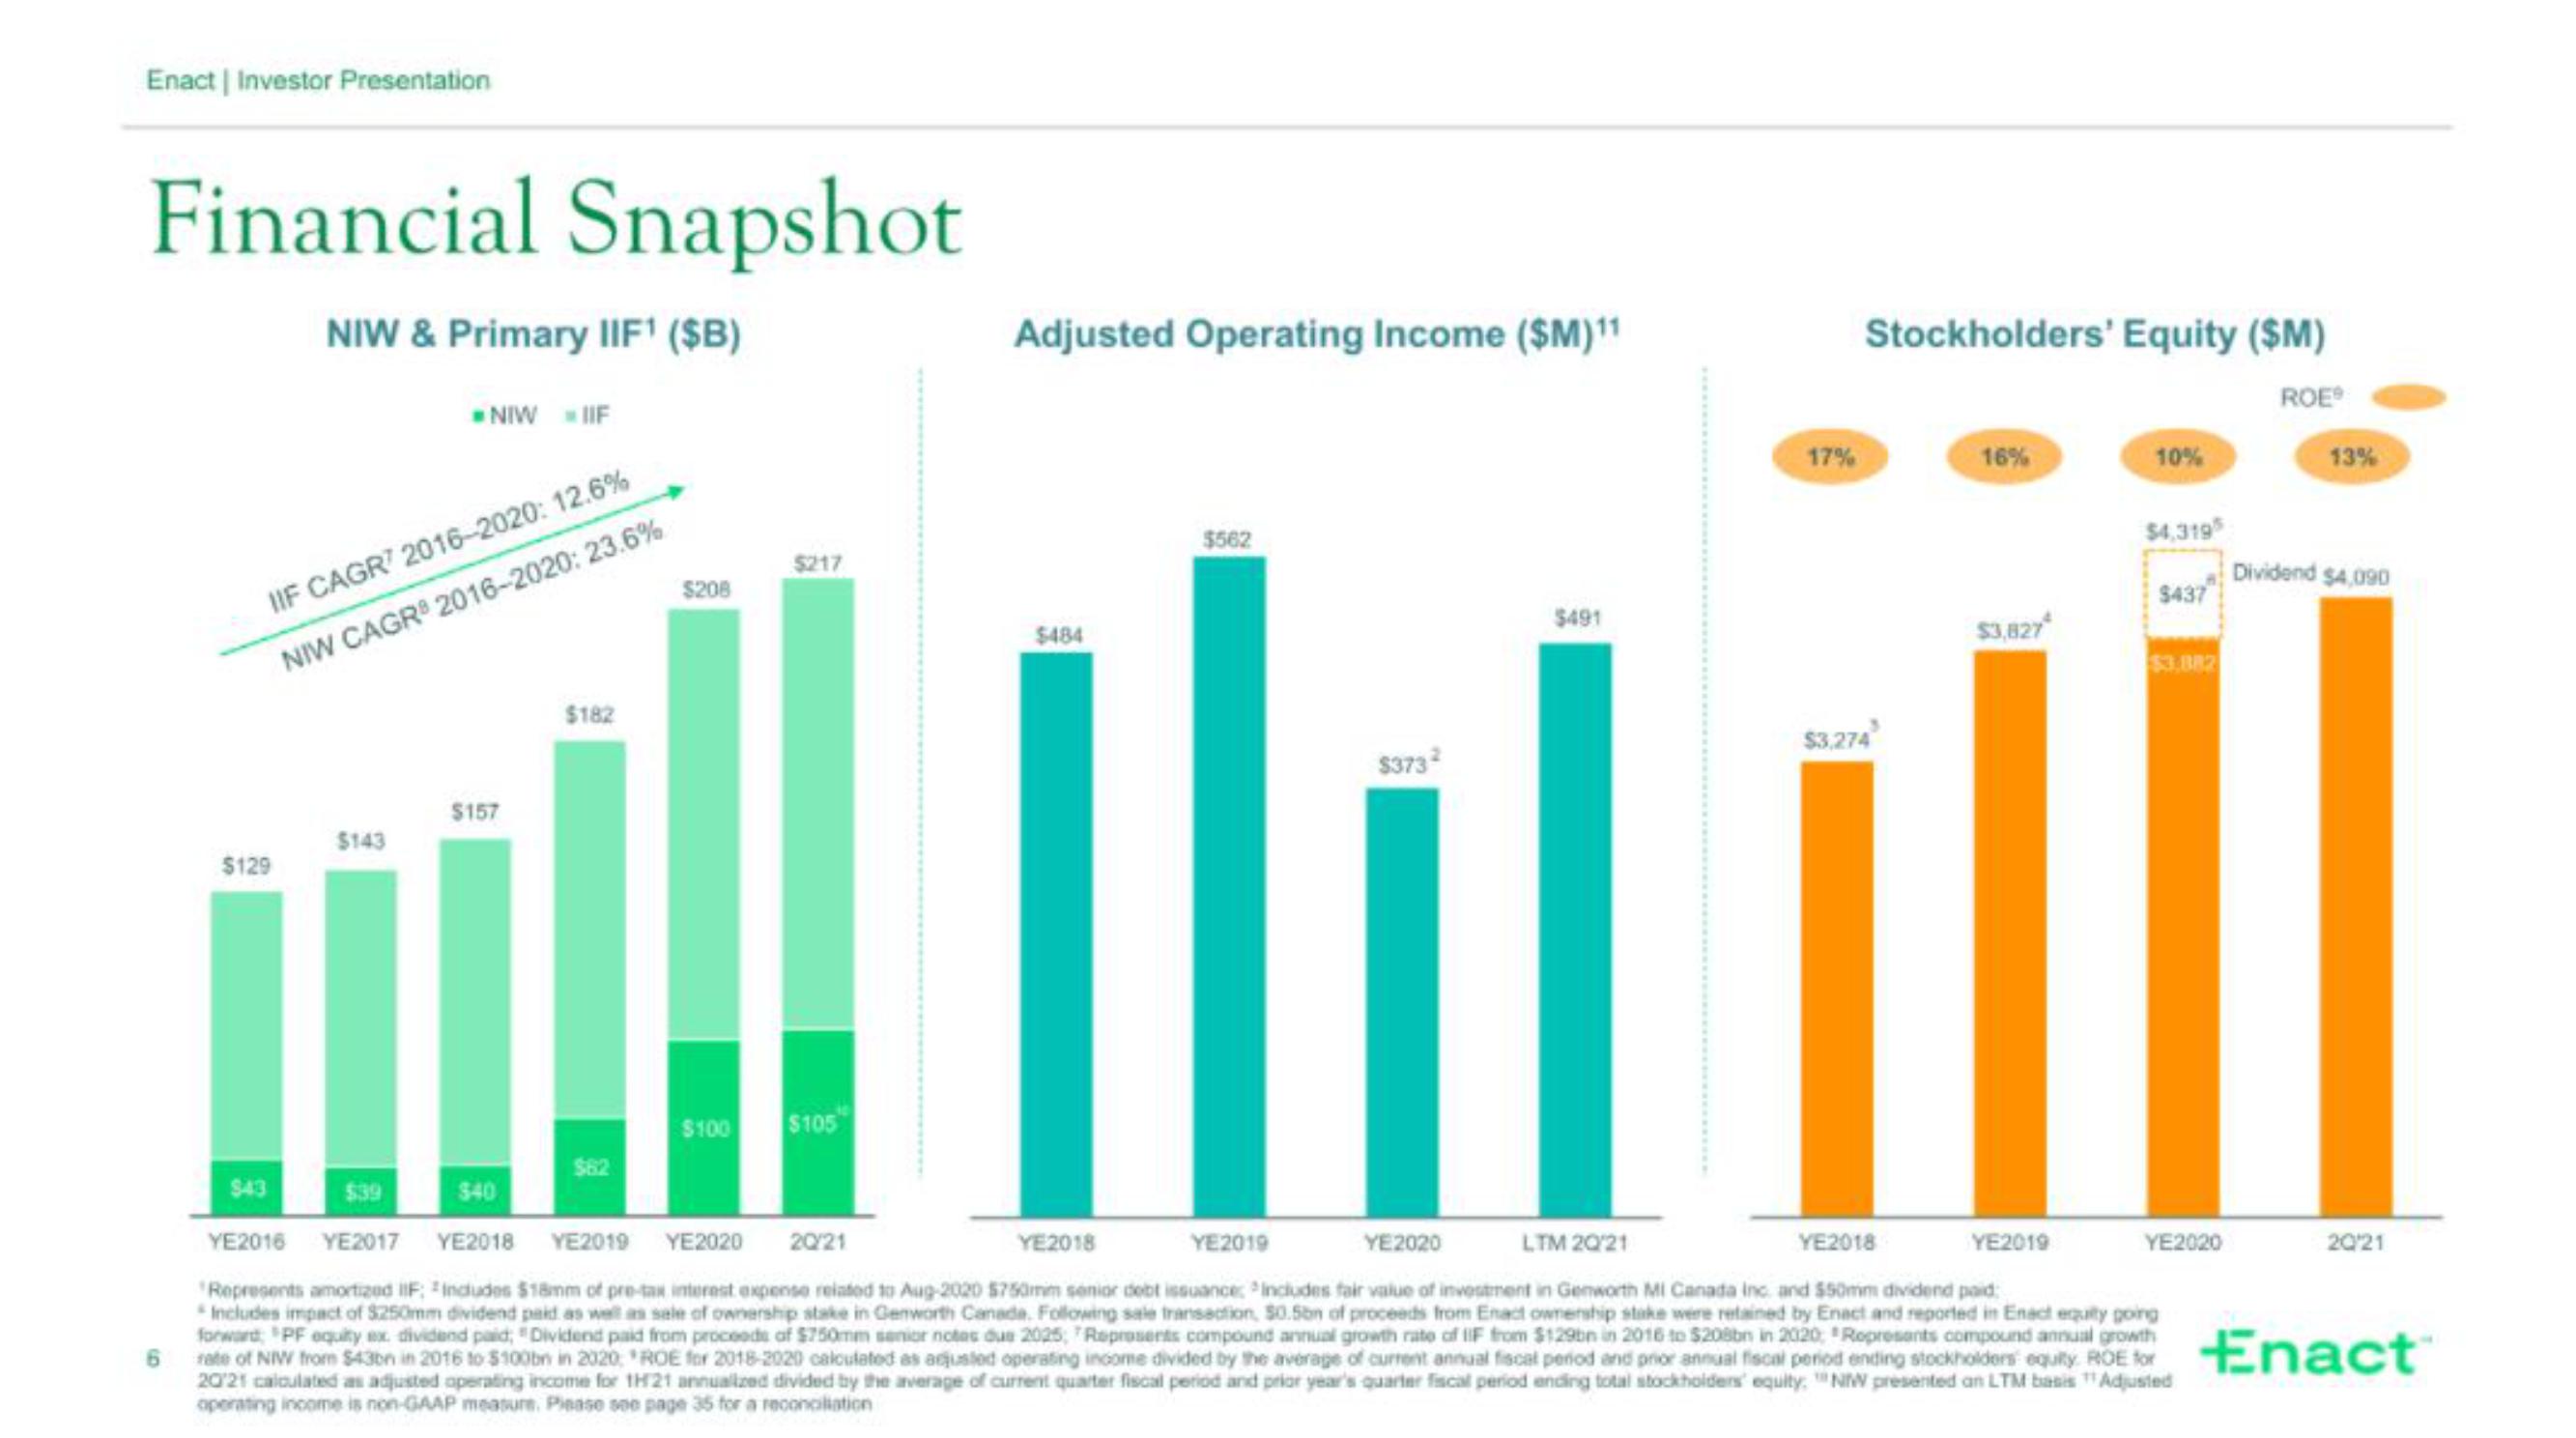
NIW & Primary IIF¹ ($B)
IIF CAGR 2016-2020: 12.6%
NIW CAGR 2016-2020: 23.6%
$129
NIW IIF
$143
$157
$182
$62
$208
$100
$217
$105
Adjusted Operating Income ($M)¹1
$484
$562
$373²
$491
17%
Stockholders' Equity ($M)
ROEⓇ
$3,274
16%
$3,827
10%
$4,3195
$437
$3,882
$43
$39
$40
YE2018
YE2020
LTM 20/21
YE2018
YE2019
YE2016 YE2017 YE2018 YE2019 YE2020 20/21
YE2019
Represents amortized IIF: Includes $18mm of pre-tax interest expense related to Aug-2020 $750mm senior debt issuance: Includes fair value of investment in Genworth MI Canada Inc. and $50mm dividend paid:
Includes impact of $250mm dividend paid as well as sale of ownership stake in Genworth Canada. Following sale transaction, $0.5bn of proceeds from Enact ownership stake were retained by Enact and reported in Enact equity going
forward PF equity ex. dividend paid, "Dividend paid from proceeds of $750mm senior notes due 2025, Represents compound annual growth rate of IF from $129bn in 2016 to $208bn in 2020, Represents compound annual growth
rate of NIW from $43bn in 2016 to $100bn in 2020, ROE for 2018-2020 calculated as adjusted operating income divided by the average of current annual fiscal period and prior annual fiscal period ending stockholders equity. ROE for
20'21 calculated as adjusted operating income for 1H21 annualized divided by the average of current quarter fiscal period and prior year's quarter fiscal period ending total stockholders' equity, NW presented an LTM basis Adjusted
operating income is non-GAAP measure. Please see page 35 for a reconciliation
YE2020
13%
Dividend $4,090
20/21
EnactView entire presentation