Liberty Global Results Presentation Deck
ALLOCATING CAPITAL EFFICIENTLY
TO DRIVE LONG-TERM SHAREHOLDER VALUE
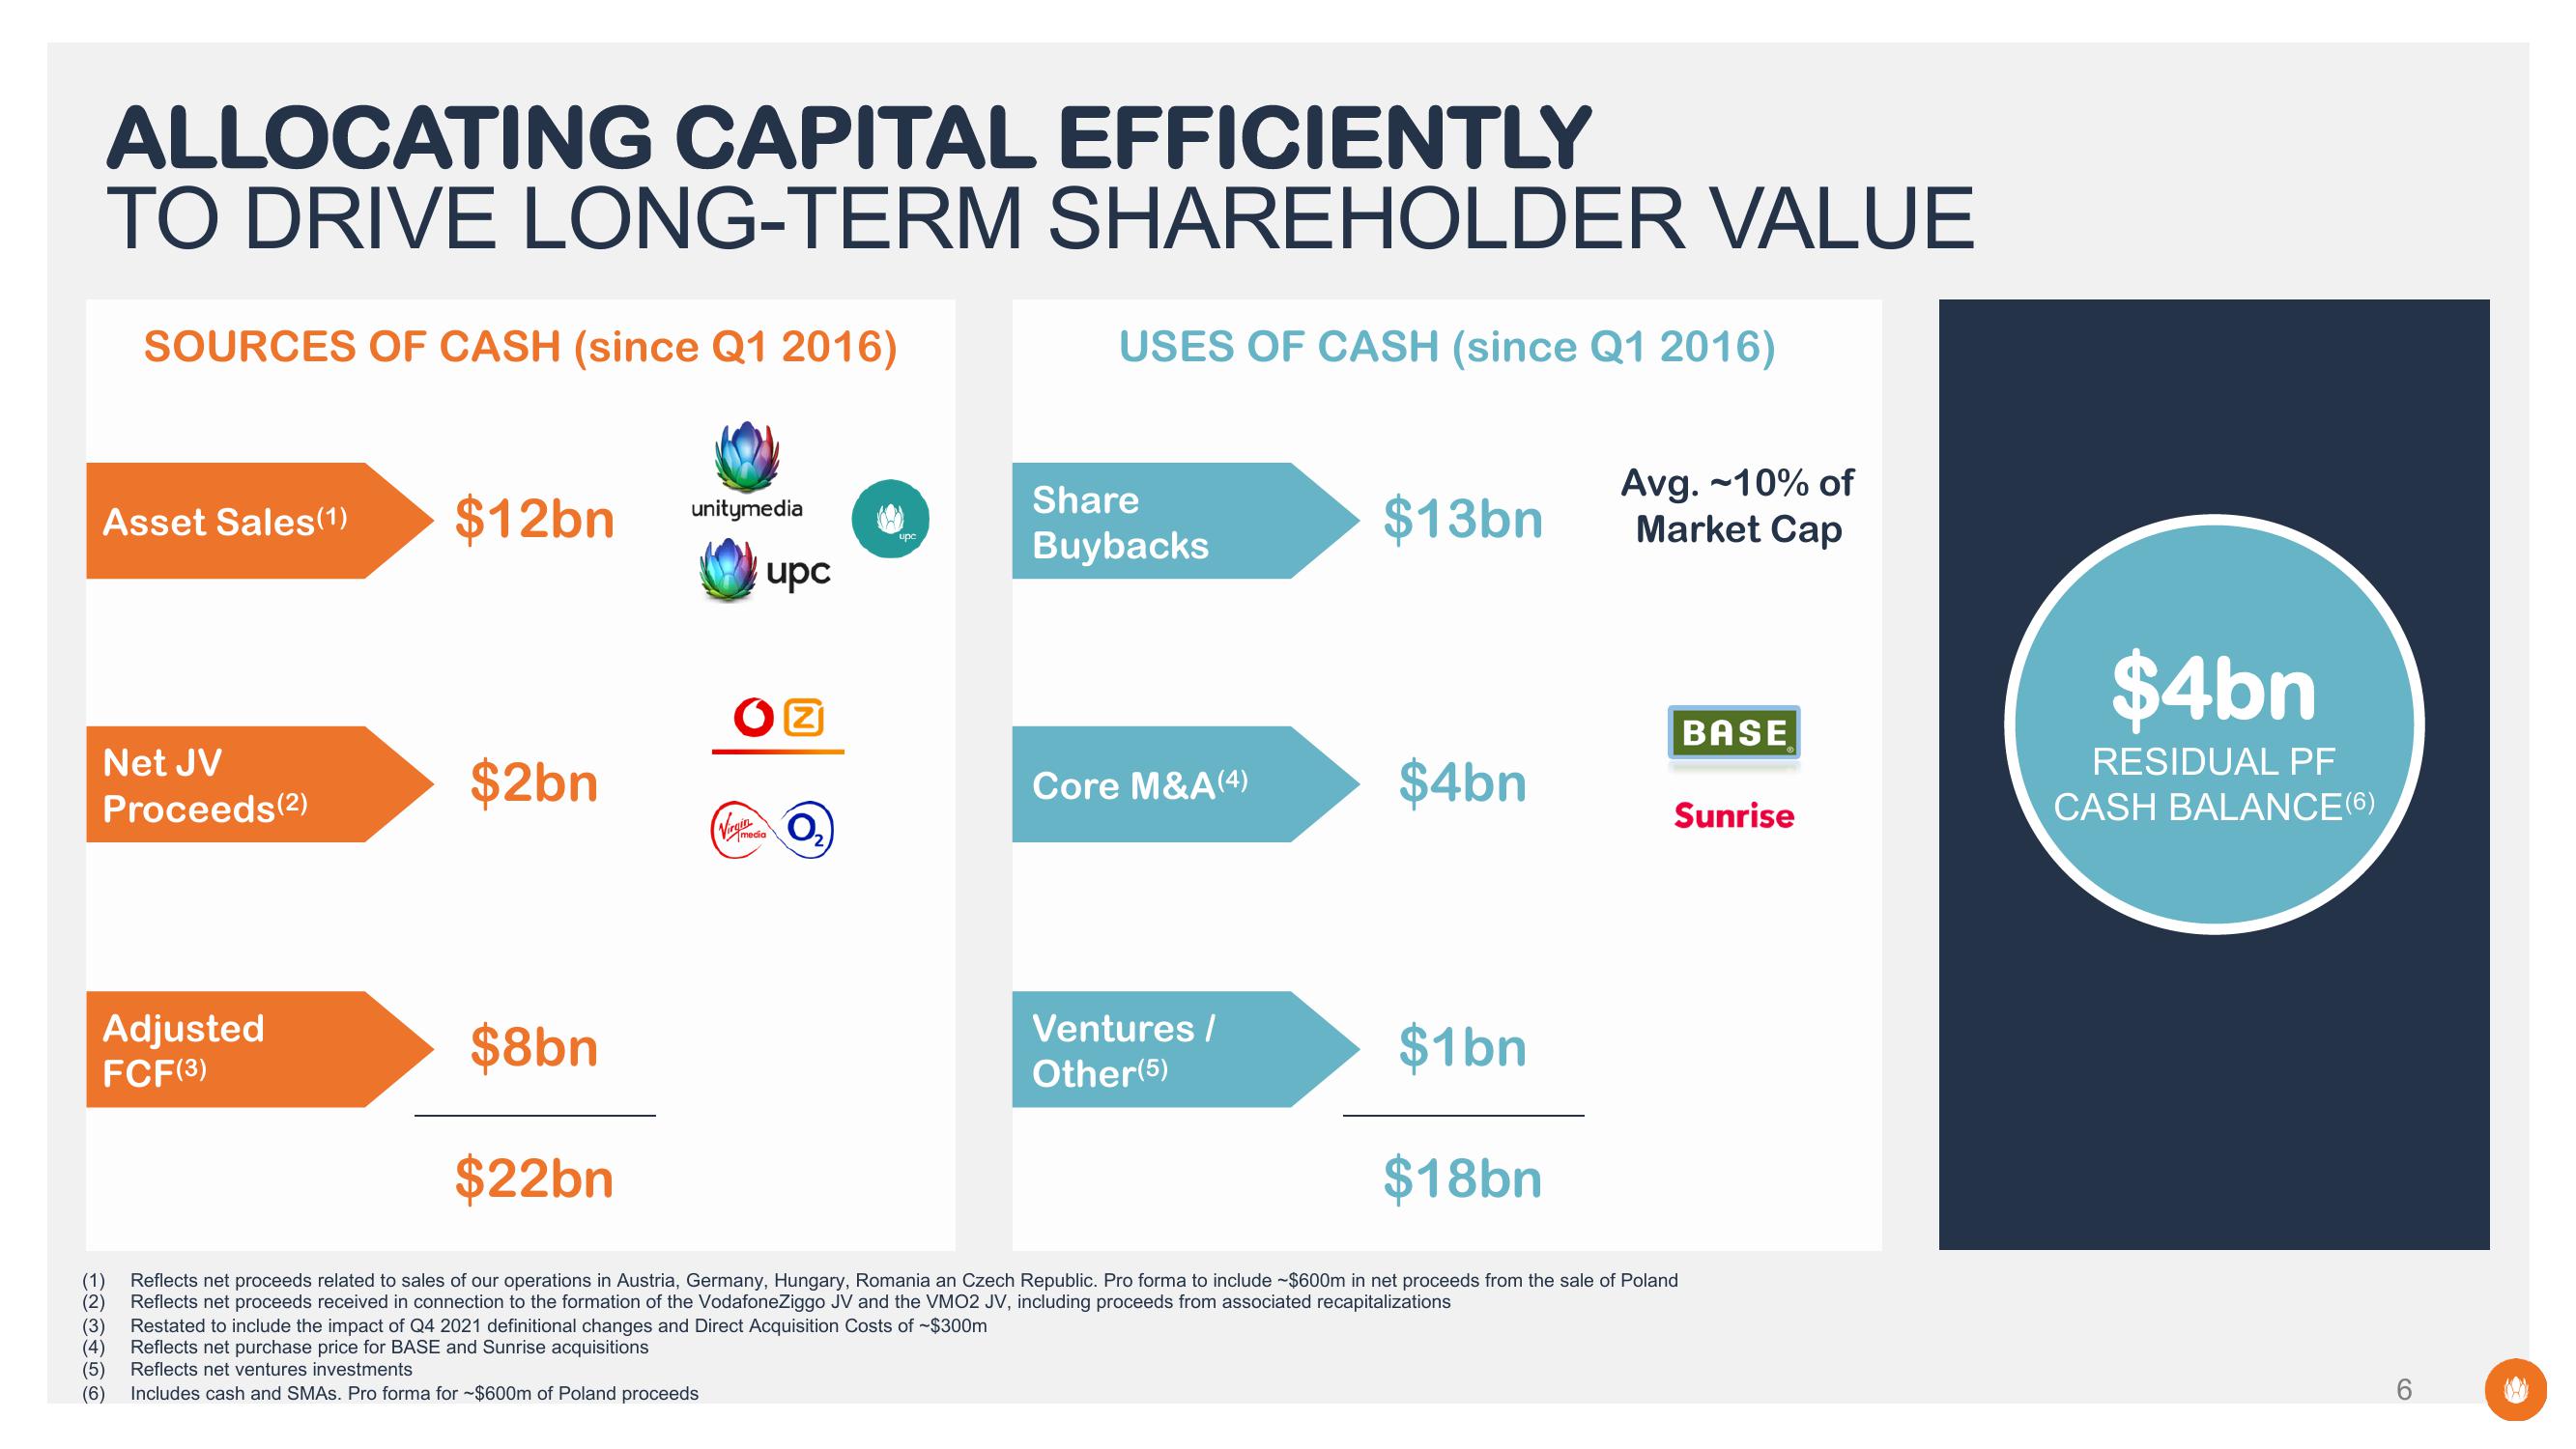
SOURCES OF CASH (since Q1 2016)
USES OF CASH (since Q1 2016)
Asset Sales(1)
Net JV
Proceeds (2)
Adjusted
FCF(3)
$12bn
$2bn
$8bn
$22bn
unitymedia
upc
Z
Virginia O₂
media
Share
Buybacks
(3)
Restated to include the impact of Q4 2021 definitional changes and Direct Acquisition Costs of $300m
(4)
Reflects net purchase price for BASE and Sunrise acquisitions
(5)
Reflects net ventures investments
(6) Includes cash and SMAS. Pro forma for $600m of Poland proceeds
Core M&A (4)
Ventures /
Other (5)
$13bn
$4bn
$1bn
$18bn
Avg. ~10% of
Market Cap
(1) Reflects net proceeds related to sales of our operations in Austria, Germany, Hungary, Romania an Czech Republic. Pro forma to include ~$600m in net proceeds from the sale of Poland
(2) Reflects net proceeds received in connection to the formation of the VodafoneZiggo JV and the VMO2 JV, including proceeds from associated recapitalizations
BASE
Sunrise
$4bn
RESIDUAL PF
CASH BALANCE (6)
6View entire presentation