TPG Results Presentation Deck
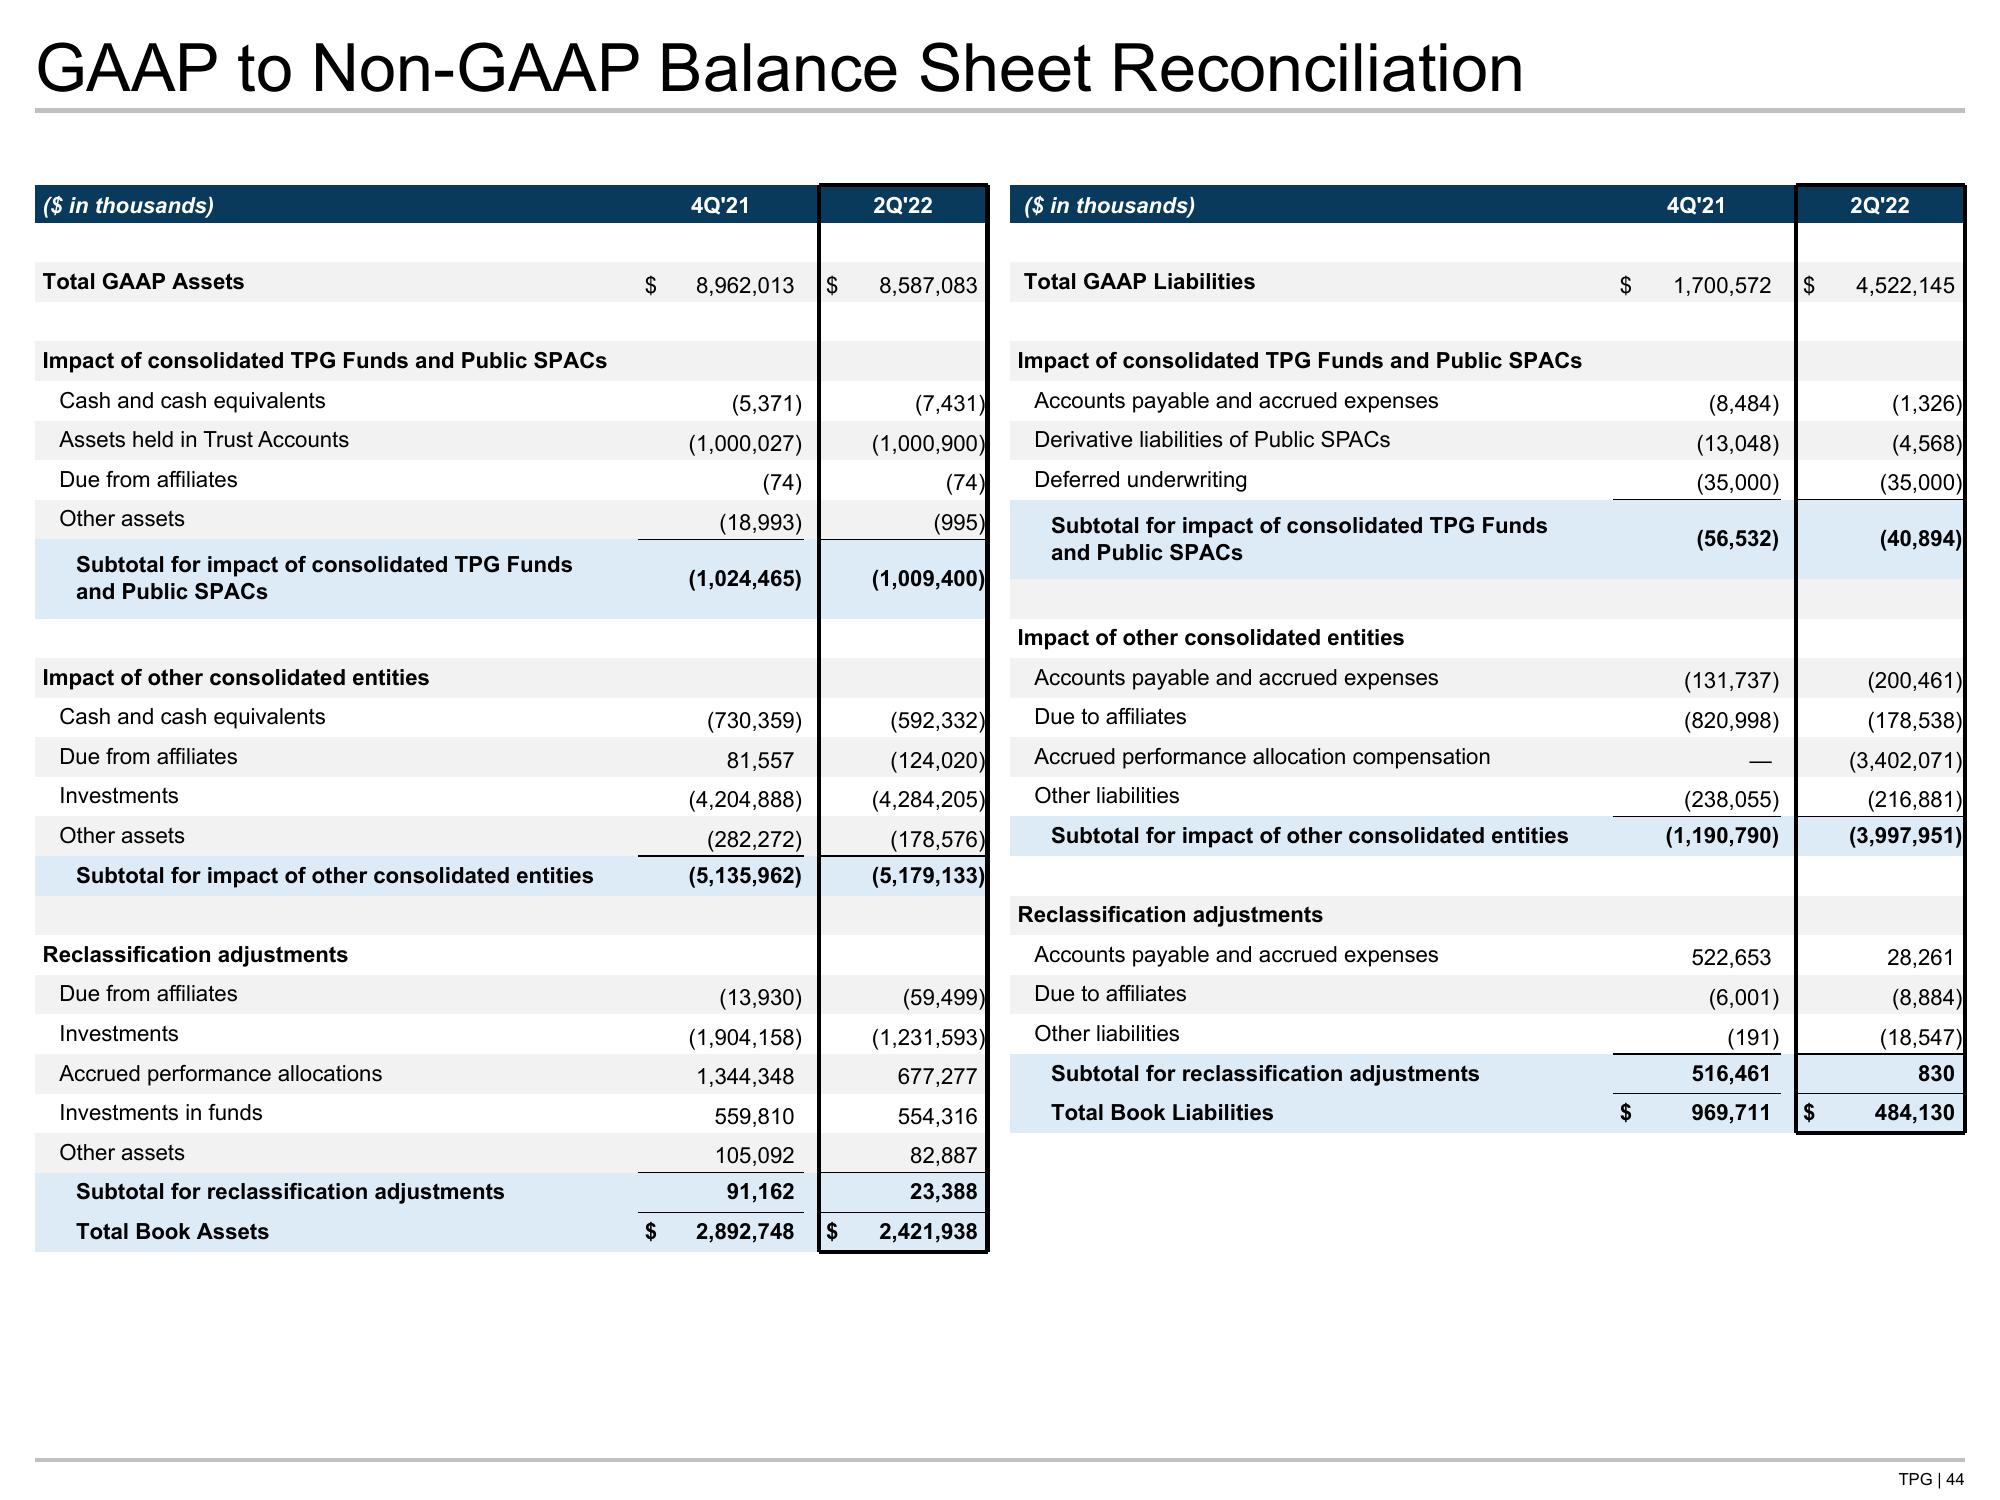
GAAP to Non-GAAP Balance Sheet Reconciliation
($ in thousands)
Total GAAP Assets
Impact of consolidated TPG Funds and Public SPACs
Cash and cash equivalents
Assets held in Trust Accounts
Due from affiliates
Other assets
Subtotal for impact of consolidated TPG Funds
and Public SPACs
Impact of other consolidated entities
Cash and cash equivalents
Due from affiliates
Investments
Other assets
Subtotal for impact of other consolidated entities
Reclassification adjustments
Due from affiliates
Investments
Accrued performance allocations
Investments in funds
Other assets
Subtotal for reclassification adjustments
Total Book Assets
$
$
4Q'21
8,962,013 $ 8,587,083
(5,371)
(1,000,027)
(74)
(18,993)
(1,024,465)
(730,359)
81,557
(4,204,888)
(282,272)
(5,135,962)
2Q'22
(13,930)
(1,904,158)
1,344,348
559,810
105,092
91,162
2,892,748
(7,431)
(1,000,900)
(74)
(995)
(1,009,400)
(592,332)
(124,020)
(4,284,205)
(178,576)
(5,179,133)
(59,499)
(1,231,593)
677,277
554,316
82,887
23,388
$ 2,421,938
($ in thousands)
Total GAAP Liabilities
Impact of consolidated TPG Funds and Public SPACs
Accounts payable and accrued expenses
Derivative liabilities of Public SPACs
Deferred underwriting
Subtotal for impact of consolidated TPG Funds
and Public SPACs
Impact of other consolidated entities
Accounts payable and accrued expenses
Due to affiliates
Accrued performance allocation compensation
Other liabilities
Subtotal for impact of other consolidated entities
Reclassification adjustments
Accounts payable and accrued expenses
Due to affiliates
Other liabilities
Subtotal for reclassification adjustments
Total Book Liabilities
$
$
4Q'21
1,700,572 $ 4,522,145
(8,484)
(13,048)
(35,000)
(56,532)
(131,737)
(820,998)
(238,055)
(1,190,790)
2Q'22
522,653
(6,001)
(191)
(1,326)
(4,568)
(35,000)
(40,894)
(200,461)
(178,538)
(3,402,071)
(216,881)
(3,997,951)
28,261
(8,884)
(18,547)
830
516,461
969,711 $ 484,130
TPG | 44View entire presentation