Ford Results Presentation Deck
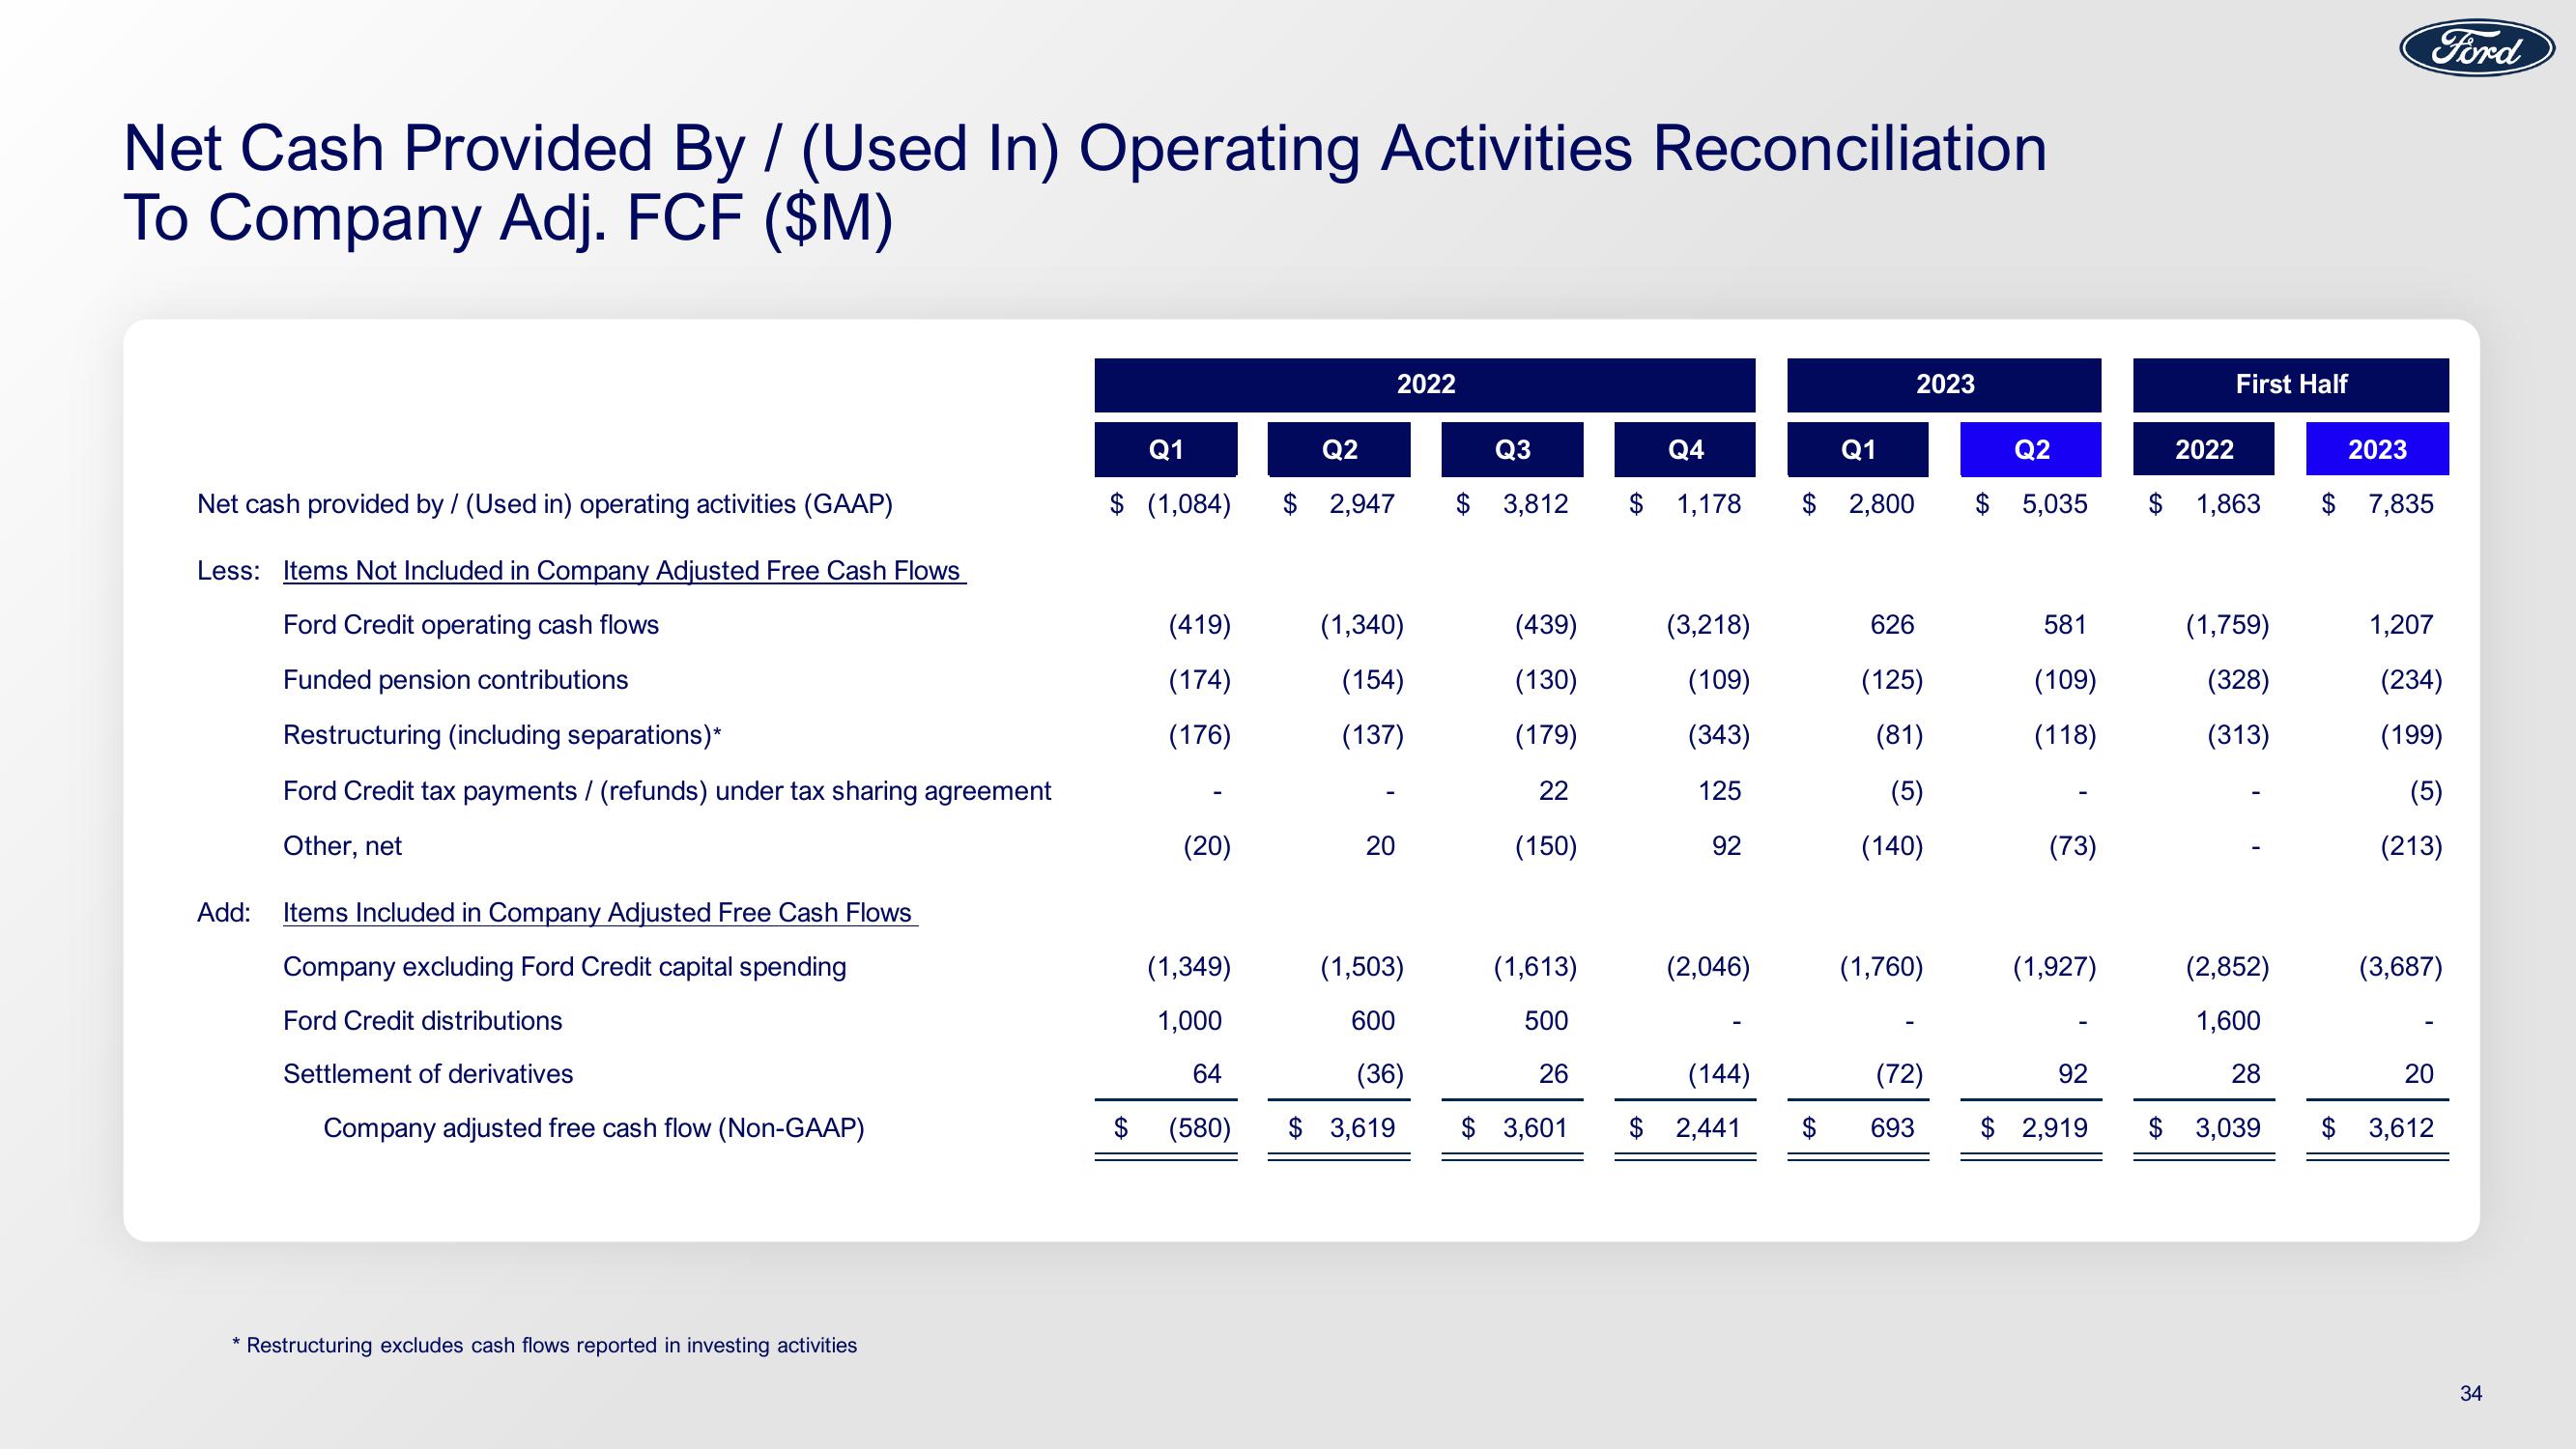
Net Cash Provided By / (Used In) Operating Activities Reconciliation
To Company Adj. FCF ($M)
Net cash provided by / (Used in) operating activities (GAAP)
Less: Items Not Included in Company Adjusted Free Cash Flows
Ford Credit operating cash flows
Funded pension contributions
Add:
Restructuring (including separations)*
Ford Credit tax payments / (refunds) under tax sharing agreement
Other, net
Items Included in Company Adjusted Free Cash Flows
Company excluding Ford Credit capital spending
Ford Credit distributions
Settlement of derivatives
Company adjusted free cash flow (Non-GAAP)
Restructuring excludes cash flows reported in investing activities
Q1
$ (1,084)
(419)
(174)
(176)
(20)
(1,349)
1,000
64
$ (580)
Q2
$ 2,947
2022
(1,340)
(154)
(137)
20
(1,503)
600
(36)
$ 3,619
Q3
$ 3,812
(439)
(130)
(179)
22
(150)
(1,613)
500
26
$ 3,601
Q4
$ 1,178
(3,218)
(109)
(343)
125
92
(2,046)
(144)
$ 2,441
2023
Q1
$ 2,800
626
(125)
(81)
(5)
(140)
(1,760)
(72)
$ 693
Q2
$ 5,035 $ 1,863
581
(109)
(118)
(73)
(1,927)
92
$ 2,919
First Half
2022
(1,759)
(328)
(313)
(2,852)
1,600
28
$ 3,039
2023
$7,835
1,207
Ford
(234)
(199)
(5)
(213)
(3,687)
20
$ 3,612
34View entire presentation