Udemy Results Presentation Deck
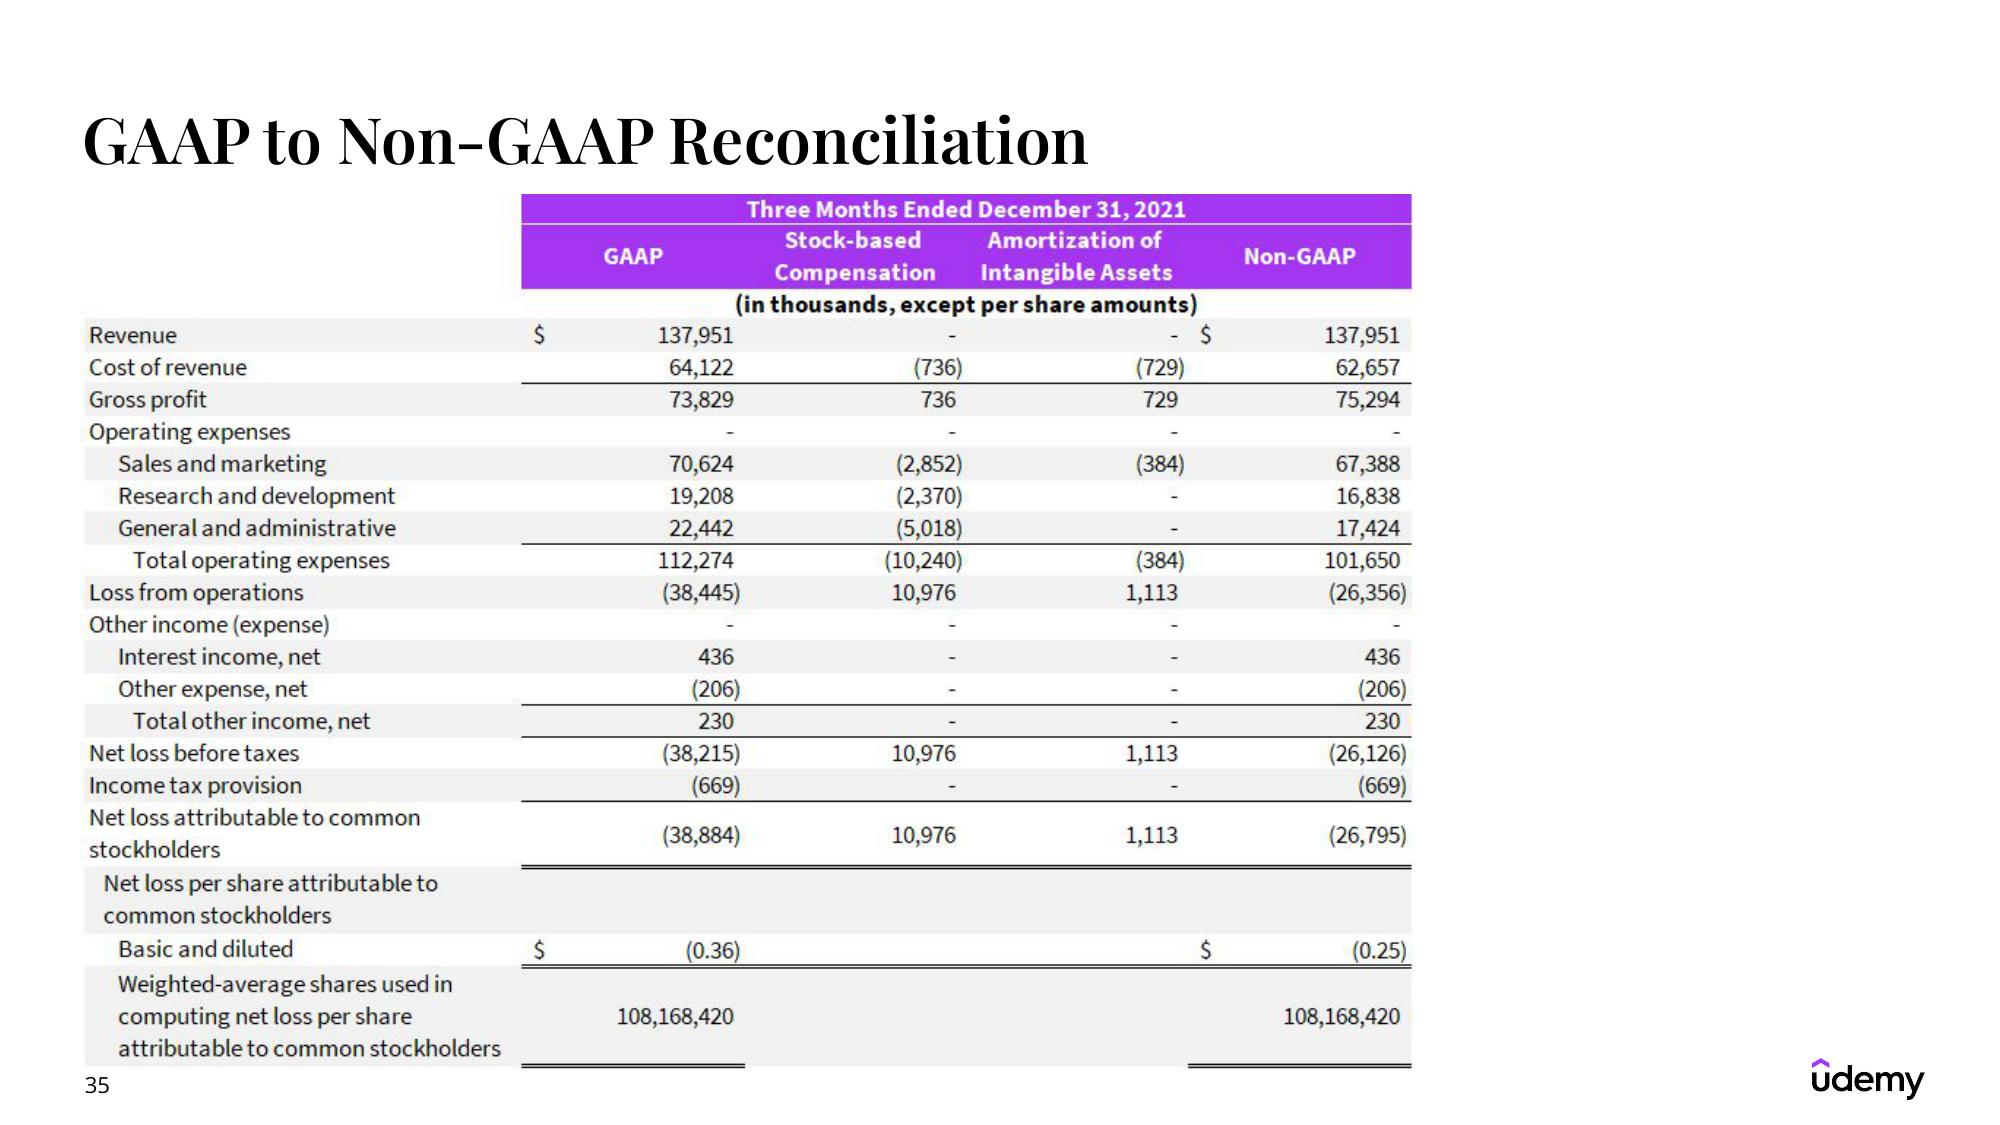
GAAP to Non-GAAP Reconciliation
Revenue
Cost of revenue
Gross profit
Operating expenses
Sales and marketing
Research and development
General and administrative
Total operating expenses
Loss from operations
Other income (expense)
Interest income, net
Other expense, net
Total other income, net
Net loss before taxes
Income tax provision
Net loss attributable to common
stockholders
35
Net loss per share attributable to
common stockholders
Basic and diluted
Weighted-average shares used in
computing net loss per share
attributable to common stockholders
$
$
GAAP
Three Months Ended December 31, 2021
Stock-based Amortization of
Compensation Intangible Assets
(in thousands, except per share amounts)
137,951
64,122
73,829
70,624
19,208
22,442
112,274
(38,445)
436
(206)
230
(38,215)
(669)
(38,884)
(0.36)
108,168,420
(736)
736
(2,852)
(2,370)
(5,018)
(10,240)
10,976
10,976
10,976
(729)
729
(384)
(384)
1,113
1,113
1,113
$
$
Non-GAAP
137,951
62,657
75,294
67,388
16,838
17,424
101,650
(26,356)
436
(206)
230
(26,126)
(669)
(26,795)
(0.25)
108,168,420
ûdemyView entire presentation