Better SPAC Presentation Deck
Maintain impressive growth &
profitability through the cycle
Normalized for interest rate movements
✓ Lowest manufacturing cost per loan in the industry
✓ Market leader in digitization and automation
✓ Superior cost structure allows for lowest price for the
customer and superior margins for investors
✓2020 was not a normal year due to COVID surplus
throughout the industry and therefore company
achieved profitability ahead of plan
¹McKinsey estimate industry steady-state D2C take rate/GOS margin: 3.00 % - 3.50%, (3.36%
average) vs. 4.06% in 2020
Better
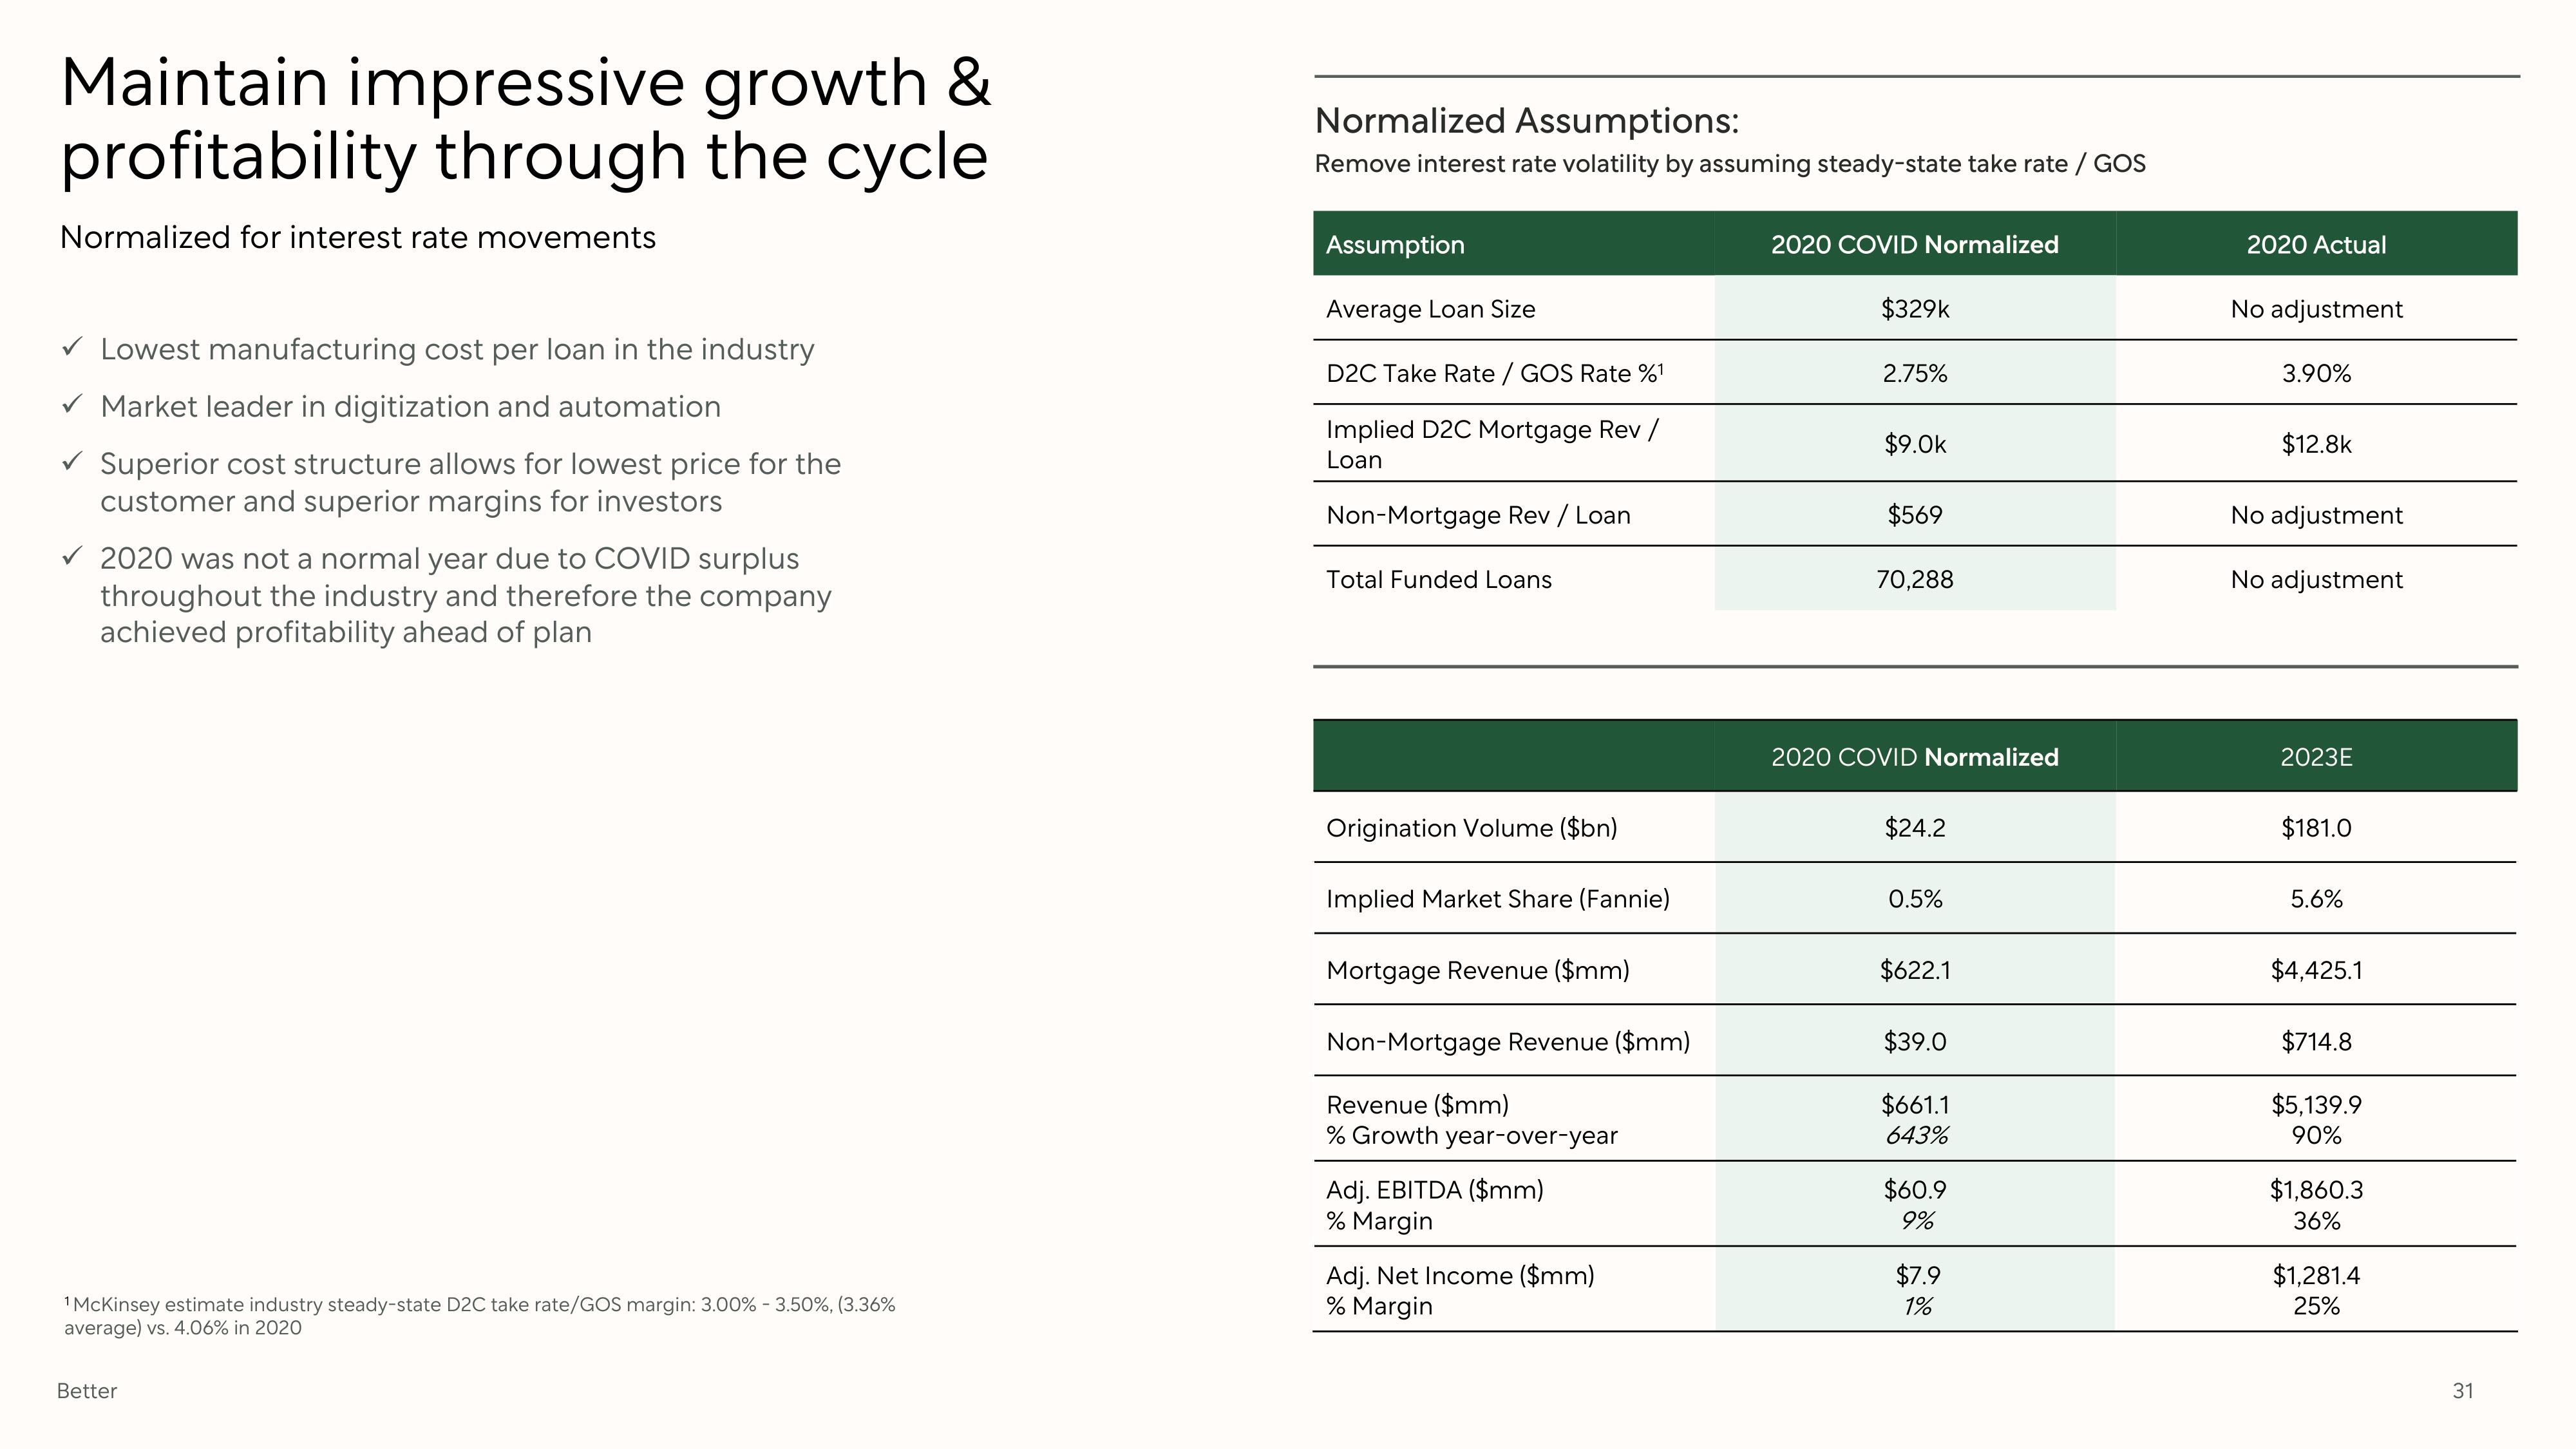
Normalized Assumptions:
Remove interest rate volatility by assuming steady-state take rate / GOS
Assumption
Average Loan Size
D2C Take Rate / GOS Rate %¹
Implied D2C Mortgage Rev /
Loan
Non-Mortgage Rev / Loan
Total Funded Loans
Origination Volume ($bn)
Implied Market Share (Fannie)
Mortgage Revenue ($mm)
Non-Mortgage Revenue ($mm)
Revenue ($mm)
% Growth year-over-year
Adj. EBITDA ($mm)
% Margin
Adj. Net Income ($mm)
% Margin
2020 COVID Normalized
$329k
2.75%
$9.0k
$569
70,288
2020 COVID Normalized
$24.2
0.5%
$622.1
$39.0
$661.1
643%
$60.9
9%
$7.9
1%
2020 Actual
No adjustment
3.90%
$12.8k
No adjustment
No adjustment
2023E
$181.0
5.6%
$4,425.1
$714.8
$5,139.9
90%
$1,860.3
36%
$1,281.4
25%
31View entire presentation