JD Sports Results Presentation Deck
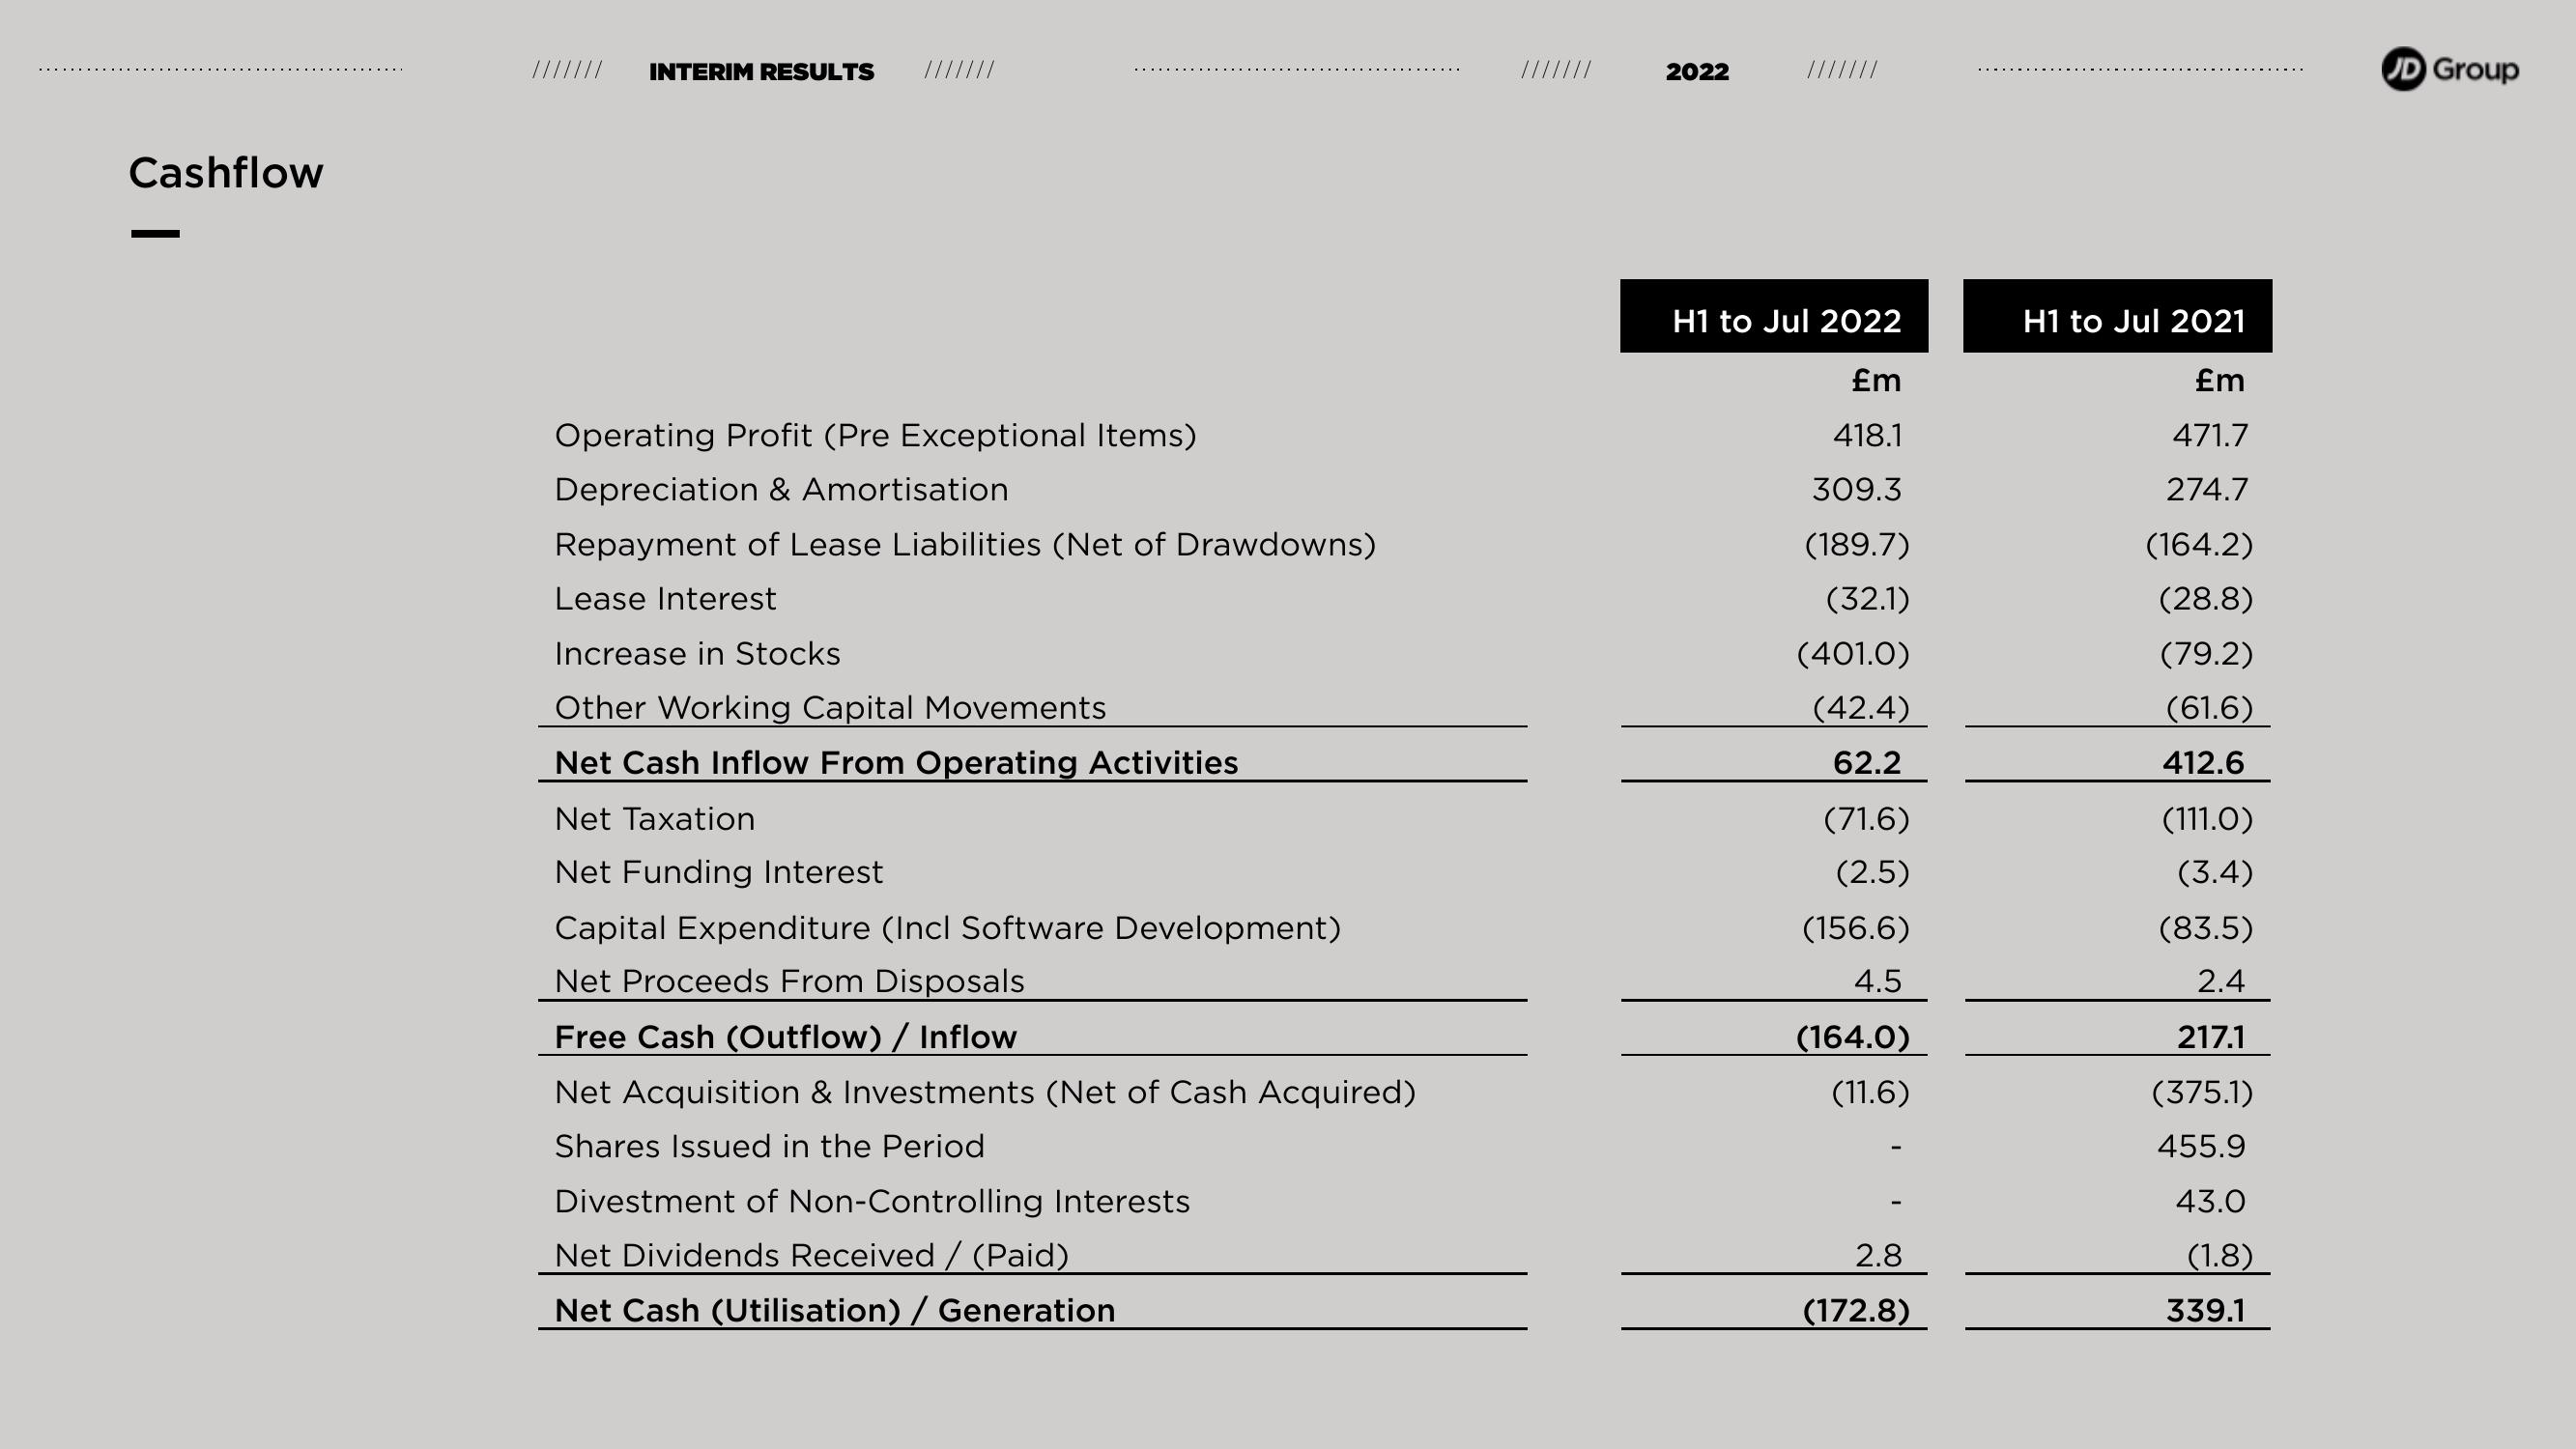
Cashflow
INTERIM RESULTS ///////
Operating Profit (Pre Exceptional Items)
Depreciation & Amortisation
Repayment of Lease Liabilities (Net of Drawdowns)
Lease Interest
Increase in Stocks
Other Working Capital Movements
Net Cash Inflow From Operating Activities
Net Taxation
Net Funding Interest
Capital Expenditure (Incl Software Development)
Net Proceeds From Disposals
Free Cash (Outflow) / Inflow
Net Acquisition & Investments (Net of Cash Acquired)
Shares Issued in the Period
Divestment of Non-Controlling Interests
Net Dividends Received / (Paid)
Net Cash (Utilisation) / Generation
///////
2022
H1 to Jul 2022
£m
418.1
309.3
(189.7)
(32.1)
(401.0)
(42.4)
62.2
(71.6)
(2.5)
(156.6)
4.5
(164.0)
(11.6)
2.8
(172.8)
H1 to Jul 2021
£m
471.7
274.7
(164.2)
(28.8)
(79.2)
(61.6)
412.6
(111.0)
(3.4)
(83.5)
2.4
217.1
(375.1)
455.9
43.0
(1.8)
339.1
JD GroupView entire presentation