Baird Investment Banking Pitch Book
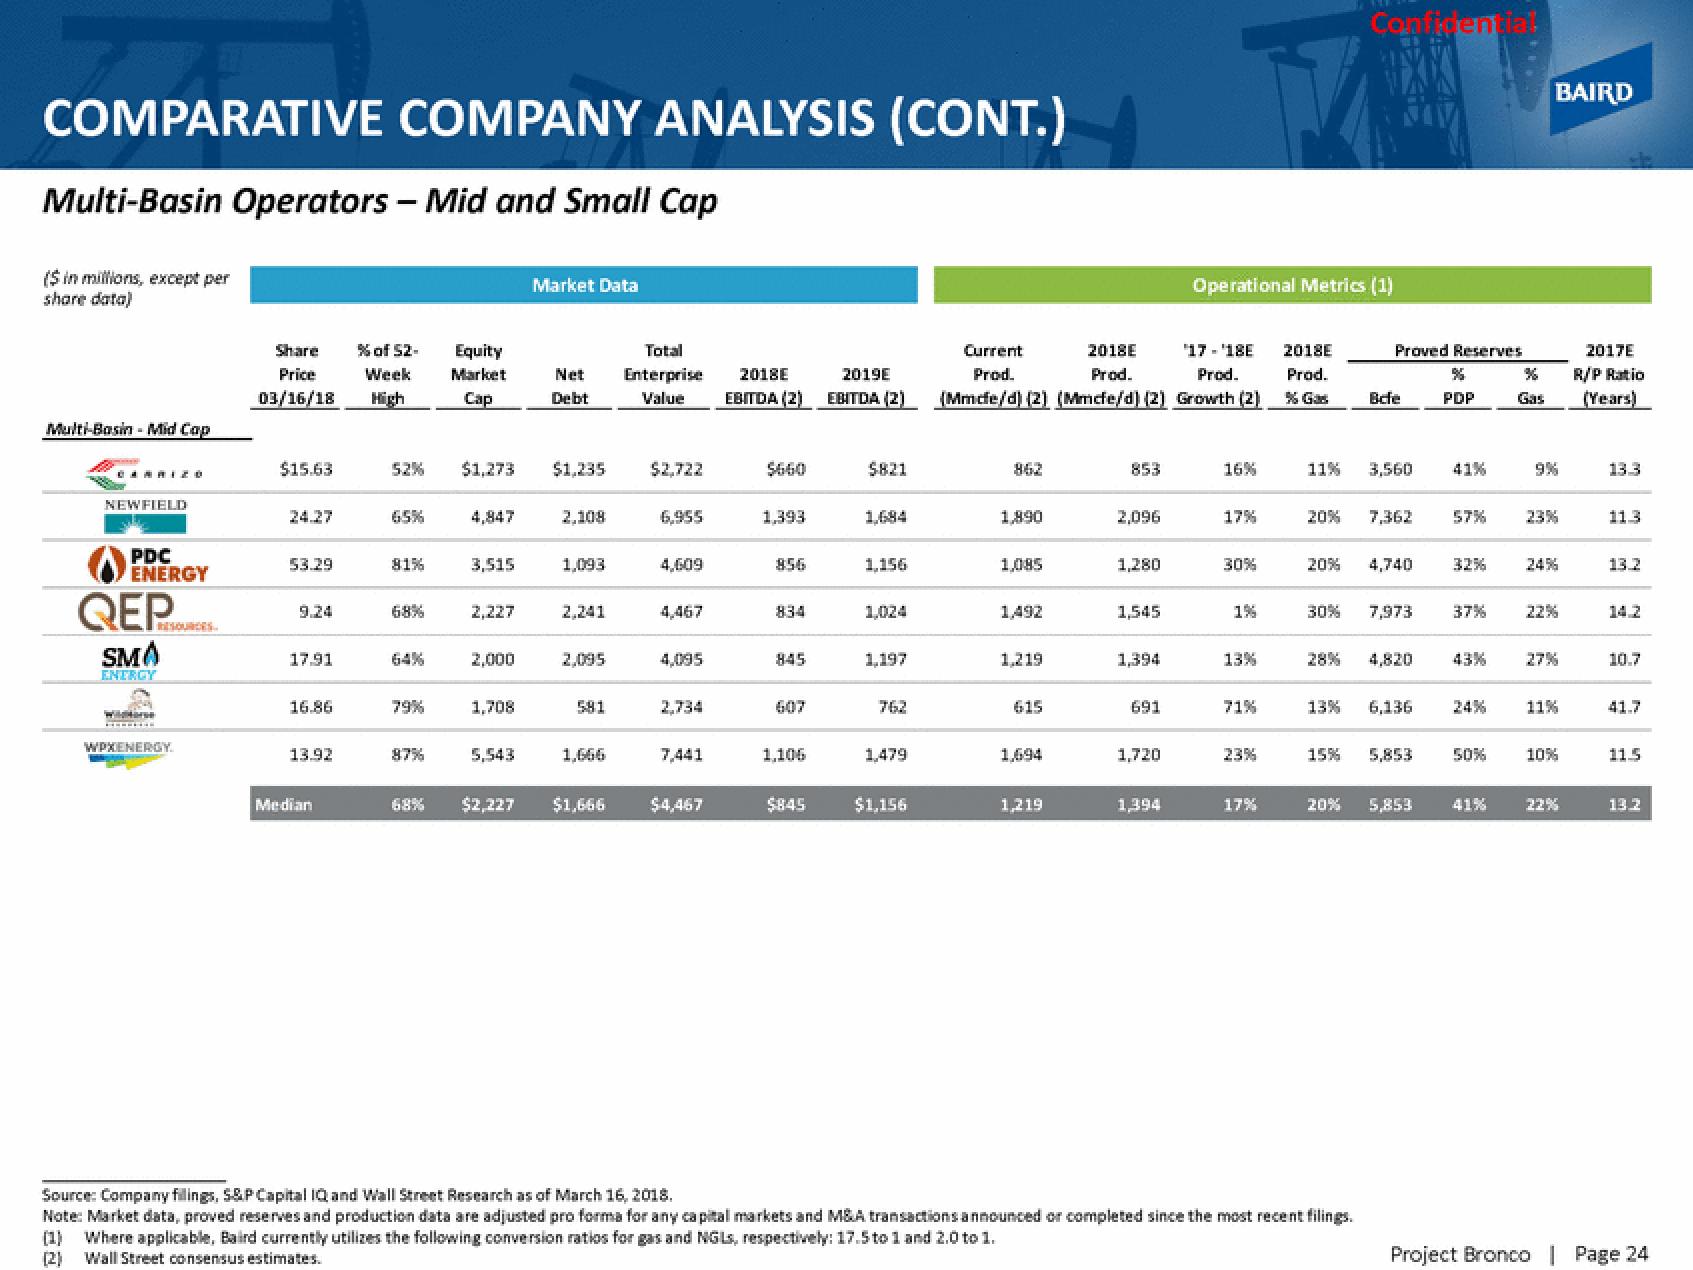
COMPARATIVE COMPANY ANALYSIS (CONT.)
Multi-Basin Operators - Mid and Small Cap
($ in millions, except per
share data)
Multi-Basin - Mid Cap
CARRIZO
NEWFIELD
PDC
ENERGY
QEP
SMA
ENERGY
widterse
WPXENERGY
Share % of 52-
Price
Week
03/16/18 High
$15.63
53.29
9.24
17.91
16.86
13.92
Median
65%
81%
52% $1,273 $1,235
68%
79%
Equity
Market
Cap
87%
4,847
3,515
2,227
2,000
1,708
Market Data
5,543
Net
2,108
1,093
2.241
2,095
581
1,666
68% $2,227 $1,666
Total
Enterprise 2018E
Value EBITDA (2)
$2,722
6,955
4,609
4,467
4,095
2,734
7,441
$4,467
$660
1,393
856
834
845
1,106
$845
2019E
EBITDA (2)
$821
1,684
1.156
1,024
1.197
762
1,479
$1,156
Current
2018E '17-'18E
Prod.
Prod.
Prod.
(Mmcfe/d) (2) (Mmcfe/d) (2) Growth (2)
862
1,890
1,085
1,492
1,219
615
1,694
1,219
853
2,096
1,280
1,545
1,394
691
1,720
1,394
Operational Metrics (1)
16%
17%
30%
1%
13%
71%
23%
17%
2018E
Prod.
% Gas
11%
20%
30%
13%
Confidential
20% 7,362
15%
Proved Reserves
Source: Company filings, S&P Capital IQ and Wall Street Research as of March 16, 2018.
Note: Market data, proved reserves and production data are adjusted pro forma for any capital markets and M&A transactions announced or completed since the most recent filings.
(1) Where applicable, Baird currently utilizes the following conversion ratios for gas and NGLs, respectively: 17.5 to 1 and 2.0 to 1.
(2)
Wall Street consensus estimates.
Befe
3,560
4,740
7,973
4,820
6.136
20% 5,853
PDP
41%
57%
32%
50%
36
Gas
41%
BAIRD
23%
37% 22%
24%
11%
10%
22%
2017E
R/P Ratio
(Years)
13.3
11.3
13.2
14.2
10.7
41.7
115
13.2
Project Bronco | Page 24View entire presentation